
Latest Dividend Announcement
Mueller Industries, Inc. has announced a 40% increase in its regular quarterly cash dividend to $0.35 per share. The new dividend exceeds the prior quarterly payout of $0.25, which the company paid throughout 2025. This step marks the sixth consecutive year in which Mueller has delivered a double-digit percentage increase to its regular dividend.
The board approved the dividend on February 19, 2026. The company will pay the distribution on March 27, 2026, to shareholders of record as of March 13, 2026. The ex-dividend date is also March 13, 2026.
Details of the Dividend Distribution
The new quarterly rate of $0.35 implies an annualized dividend of $1.40 per share. Based on a recent share price of $119.10, the forward dividend yield stands at approximately 1.19%. The trailing annual dividend rate remains $1.00, reflecting the four quarterly payments of $0.25 made in 2025.
The company maintains a conservative payout profile. The trailing payout ratio equals 14.6% of earnings. This low distribution ratio provides significant headroom for further dividend growth and protects the dividend in cyclical downturns. The increase from $1.00 to $1.40 on an annualized basis represents a substantial step-up in capital returns, yet it remains well covered by projected earnings.
Relevant Valuation Metrics
Mueller operates with strong profitability metrics. The company generated total revenue of $4.18 billion and EBITDA of approximately $0.96 billion in the last fiscal year. EBITDA margins reached 23.1%, which indicates solid operating leverage in a capital-intensive metal fabrication environment.
The market currently values the company at about $13.2 billion in market capitalization and $11.7 billion in enterprise value. The forward price-to-earnings ratio stands at 14.3, based on forward EPS of $8.35. The trailing P/E ratio equals 17.1. These multiples remain moderate compared to many industrial peers, particularly in light of projected earnings growth of 14.1%.
Free cash flow amounts to roughly $499 million. This figure comfortably exceeds the annual cash requirement for dividends, even after the increase. The company also reports total cash of about $1.39 billion and minimal total debt of $27.5 million. This net cash position strengthens financial flexibility and underpins dividend sustainability.
Dividend History and Sustainability
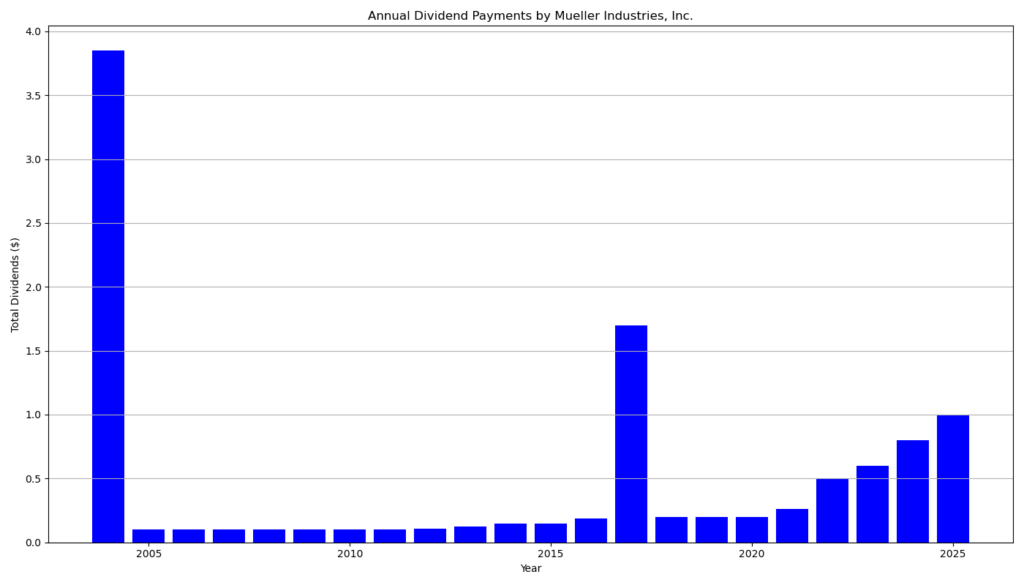
Mueller has paid uninterrupted dividends for 21 consecutive years. The company has increased its regular dividend for five consecutive years. The historical record shows a long period of stable $0.025 quarterly payments from 2004 through 2011. Management initiated a structural growth phase beginning in 2012. Since 2021, the quarterly dividend has accelerated from $0.065 to $0.125 in 2022, $0.150 in 2023, $0.200 in 2024, $0.250 in 2025, and now $0.35 in 2026.
This trajectory reflects both earnings expansion and disciplined capital allocation. With a payout ratio below 15% and strong free cash flow coverage, the current dividend level appears highly sustainable. The balance sheet carries low financial risk, and liquidity remains abundant.
Outlook for Long-Term Investors
Mueller combines cyclical exposure with structural growth drivers in infrastructure, HVAC, and industrial applications. Revenue growth recently reached 4.2%, while earnings continue to expand at double-digit rates. Analysts project a median price target of $140, which implies upside potential in addition to dividend income.
Long-term investors benefit from three pillars: earnings growth, conservative leverage, and disciplined capital returns. The company’s low beta of 1.02 signals market-aligned volatility without excessive risk.
A Brief Company Profile
Mueller Industries, Inc. operates in the metal fabrication sector within the industrials space. The company manufactures copper, brass, aluminum, and plastic products for air, water, oil and gas distribution, climate systems, electrical transmission, medical technology, aerospace, and automotive markets. It maintains a diversified geographic footprint across North America, Europe, Asia, and the Middle East.
last quarterly report*
Mueller Industries filed a Form 8‑K on February 3, 2026, reporting strong fourth quarter and full-year 2025 results .
For the fourth quarter of 2025, net sales rose 4.2% to $962.4 million, up from $923.5 million in the prior-year period. Operating income increased slightly to $172.0 million from $170.3 million. Net income attributable to Mueller Industries reached $153.7 million, up 11.6% year over year. Diluted earnings per share improved 14.0% to $1.38 from $1.21. The company generated $141.2 million in operating cash flow during the quarter.
For the full year 2025, performance improved significantly. Net sales grew 10.5% to $4.18 billion, compared with $3.77 billion in 2024. Operating income increased 24.4% to $958.5 million. Net income attributable to Mueller Industries rose 26.5% to $765.2 million. Diluted EPS climbed 29.2% to $6.86 from $5.31. Operating cash flow for the year totaled $755.4 million.
The company reported that higher copper prices supported revenue growth, although lower unit volumes partially offset the benefit. An $18.2 million unrealized hedge loss negatively affected gross margin in the fourth quarter due to a rapid rise in copper prices late in the period.
Segment results show that the Piping Systems segment remained the largest contributor, with full-year sales of $2.71 billion and operating income of $772.3 million. The Industrial Metals segment generated $1.02 billion in sales and $105.0 million in operating income. The Climate segment delivered $497.9 million in sales and $145.1 million in operating income.
Mueller ended the year with a very strong balance sheet. Cash and cash equivalents totaled approximately $1.37 billion, with an additional $22.7 million in short-term investments. The company reported no debt at year-end. Total liabilities stood at $497.1 million, while total equity reached $3.24 billion. The current ratio was 5.9 to 1, reflecting high liquidity.
Capital allocation remained shareholder-friendly. During 2025, Mueller paid $109.1 million in dividends to its shareholders and repurchased $243.6 million of common stock. Dividends per share increased to $1.00 for the full year, up from $0.80 in 2024. Quarterly dividends rose to $0.25 per share from $0.20 in the prior year.
Management highlighted that 2025 delivered the highest annual operating and net income in company history, despite challenging market conditions and tariff-related disruptions. While the company does not expect an immediate market rebound in 2026, it anticipates gradual improvement throughout the year and benefits from operational initiatives completed in 2025.
Overall, Mueller Industries enters 2026 with record profitability, strong cash generation, no debt, and substantial liquidity to fund capital investments, acquisitions, dividends, and share repurchases.
*This is the latest quarterly report that the company has filed with the SEC.
Die Selektion dieser Aktie erfolgte zufällig aus einem breiten Spektrum an tagesaktuellen Börsenmitteilungen bezüglich angekündigter Dividendenzahlungen. Der vorliegende Beitrag zielt nicht auf eine qualitative Bewertung dieser dividendenstarken Aktie ab, sondern verfolgt einen rein deskriptiven Ansatz.
Was sind Dividend Champions, Contenders, Challengers?