
Latest dividend announcement
Applied Materials announced a significant increase in its quarterly cash dividend. The company will raise the dividend from $0.46 to $0.53 per share, representing a 15.2% increase. This marks the ninth consecutive year of dividend growth for the semiconductor equipment manufacturer. The new dividend reflects management’s confidence in the company’s cash-generation capacity and its commitment to returning capital to shareholders while continuing to invest in technological innovation and capacity expansion.
Details of the dividend distribution
The board approved the quarterly dividend of $0.53 per share, payable on June 11, 2026. Shareholders recorded as of May 21, 2026 will receive the payment. The ex-dividend date also falls on May 21, 2026.
Based on the new quarterly payout, Applied Materials will distribute approximately $2.12 per share annually. At a share price around $342, the dividend implies a forward dividend yield of roughly 0.6%. The previous dividend of $0.46 per quarter equated to an annualized payout of $1.84 per share, confirming the magnitude of the increase.
Although the yield remains relatively modest compared with traditional income sectors, the company prioritizes dividend growth and share repurchases as complementary elements of its capital allocation strategy.
Relevant valuation metrics
Applied Materials currently commands a market capitalization of about $271 billion, placing it among the largest semiconductor equipment suppliers globally. The company trades at a forward price-to-earnings ratio of approximately 24.7, based on forward earnings per share of about $13.84.
Profitability metrics remain robust. Applied Materials generates EBITDA of nearly $8.9 billion, corresponding to an EBITDA margin of roughly 31.5%. Free cash flow stands near $4.3 billion, which provides substantial financial flexibility for dividends and buybacks.
The dividend payout ratio of approximately 18% signals a conservative distribution policy. This low payout level leaves ample capacity for further dividend growth while maintaining high levels of capital expenditure and research investment.
Balance sheet metrics also support the dividend policy. The company holds more than $8.5 billion in cash against total debt of roughly $7.2 billion, resulting in a solid liquidity profile.
Dividend history and sustainability
Applied Materials maintains a long and steadily improving dividend track record. The company has paid uninterrupted dividends for 20 consecutive years and delivered eight consecutive years of dividend increases before the latest raise extended the streak to nine.
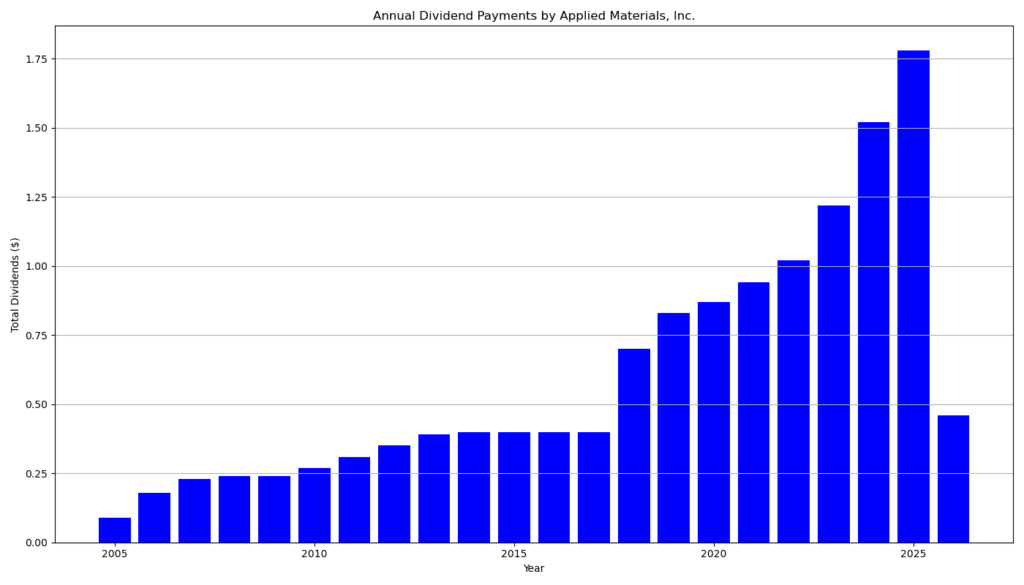
Over the past decade, the dividend expanded at a compound annual growth rate of approximately 18%. The company has also more than doubled its dividend per share over the past four years, demonstrating accelerating shareholder distributions during the semiconductor investment cycle.
Historical data illustrates the long-term progression. The quarterly dividend remained $0.10 between 2013 and 2017, doubled to $0.20 in 2018, and subsequently increased in multiple steps to $0.46 in 2025 before reaching $0.53 in 2026.
Management has also distributed substantial capital through share repurchases. Over the past decade, the company returned nearly 90% of free cash flow to shareholders through a combination of dividends and buybacks.
Outlook for long-term investors
The dividend increase aligns with strong earnings momentum in the semiconductor equipment market. Applied Materials benefits from structural demand drivers such as artificial intelligence, high-performance computing, advanced memory, and next-generation chip architectures.
These technologies require increasingly complex manufacturing equipment, which supports sustained investment by leading chipmakers. As semiconductor manufacturers expand capacity for advanced nodes and high-bandwidth memory, equipment suppliers such as Applied Materials capture growing order volumes.
For long-term investors, the combination of strong earnings growth, low payout ratio, and high free cash flow generation creates a favorable environment for continued dividend growth.
Company profile
Applied Materials, Inc. operates as a leading provider of semiconductor fabrication equipment and materials engineering solutions. The company develops deposition, etching, inspection, and process control systems used in the production of advanced semiconductors and display technologies.
Headquartered in Santa Clara, California, Applied Materials serves major chip manufacturers worldwide and operates within the Semiconductor Equipment & Materials industry. Its technologies support the production of advanced processors, memory chips, and specialized components used in artificial intelligence, data centers, consumer electronics, and automotive systems.
last quarterly report*
Overview
Applied Materials reported solid profitability and strong cash generation in the first quarter of fiscal 2026 despite slightly lower revenue. Growth in AI-related semiconductor demand supported earnings and operating cash flow.
Key Financial Results (Q1 FY2026)
- Revenue: $7.01 billion (down 2% year over year)
- GAAP net income: $2.03 billion (up 71% YoY)
- GAAP EPS: $2.54 (up 75% YoY)
- Non-GAAP EPS: $2.38 (unchanged YoY)
- Gross margin: 49.0% (slightly improved from 48.8%)
- Operating margin: 26.1%
- Non-GAAP free cash flow: $1.04 billion (up from $544 million last year)
Cash Flow and Capital Allocation
- Operating cash flow: $1.69 billion
- Shareholder returns: $702 million total
- Dividends: $365 million
- Share repurchases: $337 million
Strong free cash flow and continued capital returns indicate a healthy financial position and support the company’s dividend policy.
Business Segment Performance
Semiconductor Systems
- Revenue: $5.14 billion (decline from $5.60 billion YoY)
- Operating margin: 27.8%
- DRAM represented 34% of segment revenue, up from 27%, reflecting stronger memory demand.
Applied Global Services
- Revenue: $1.56 billion (up from $1.35 billion)
- Operating margin: 28.1%
The services segment delivered record revenue, providing recurring income and improving margins.
Balance Sheet Highlights
- Cash and equivalents: $7.22 billion
- Total assets: $37.6 billion
- Total liabilities: $15.9 billion
- Long-term debt: $6.45 billion
The balance sheet remains strong with substantial liquidity and moderate leverage.
Geographic Revenue Mix
Major markets include:
- China: 30% of revenue
- Taiwan: 25%
- Korea: 21%
This reflects heavy exposure to Asian semiconductor manufacturing hubs.
Outlook
For Q2 FY2026, the company expects:
- Revenue: about $7.65 billion ± $500 million
- Non-GAAP EPS: about $2.64 ± $0.20
Management expects continued growth driven by investments in AI computing, advanced logic, and high-bandwidth memory.
Strategic Highlights
- Expansion of the EPIC Center in Silicon Valley with Samsung participation.
- New equipment platforms for 2‑nm semiconductor manufacturing and advanced transistor architectures.
- Multiple technology and sustainability awards from major chipmakers.
Bottom Line
Applied Materials delivered strong earnings growth and significantly higher free cash flow, even with modest revenue decline. The company benefits from structural demand for advanced semiconductors tied to AI and high-performance computing. Strong cash generation supports dividends and buybacks, making the business financially attractive for long-term investors.
*This is the latest quarterly report that the company has filed with the SEC.
Next Earnings Date: 5/14/2026 After close
Die Selektion dieser Aktie erfolgte zufällig aus einem breiten Spektrum an tagesaktuellen Börsenmitteilungen bezüglich angekündigter Dividendenzahlungen. Der vorliegende Beitrag zielt nicht auf eine qualitative Bewertung dieser dividendenstarken Aktie ab, sondern verfolgt einen rein deskriptiven Ansatz.
Was sind Dividend Champions, Contenders, Challengers?