
Latest dividend announcement
The TJX Companies, Inc. announced a quarterly dividend of $0.48 per share, representing a 12.9% increase from the previous $0.42 level. The dividend will be paid on June 4, 2026, to shareholders of record as of May 14, 2026. The ex-dividend date is also May 14. This marks the company’s 29th dividend increase in the past 30 years, reinforcing its long-standing capital return strategy.
Details of the dividend distribution
The new annualized dividend amounts to $1.92 per share, resulting in a forward dividend yield of approximately 1.22% at current price levels near $160. The prior annual payout stood at $1.70, indicating a clear upward trajectory. TJX maintains a balanced capital allocation framework. Management combines dividend growth with significant share repurchases, targeting $2.5B to $2.75B in buybacks for fiscal 2027. This dual approach enhances total shareholder yield and supports per-share earnings accretion.
Relevant valuation metrics
TJX operates with strong profitability and cash generation. Fiscal 2026 revenue reached approximately $60.4B, while net income totaled about $5.5B . The company generated $6.9B in operating cash flow and roughly $3.9B in free cash flow, which comfortably covers dividend obligations.
The payout ratio of 33.9% indicates conservative dividend coverage and leaves room for further increases. The stock trades at a forward P/E of ~28x and an EV/EBITDA multiple above 22x, reflecting a premium valuation relative to the broader retail sector. Profitability remains robust, with an EBITDA margin near 14%. However, the elevated valuation compresses the yield and limits immediate income attractiveness.
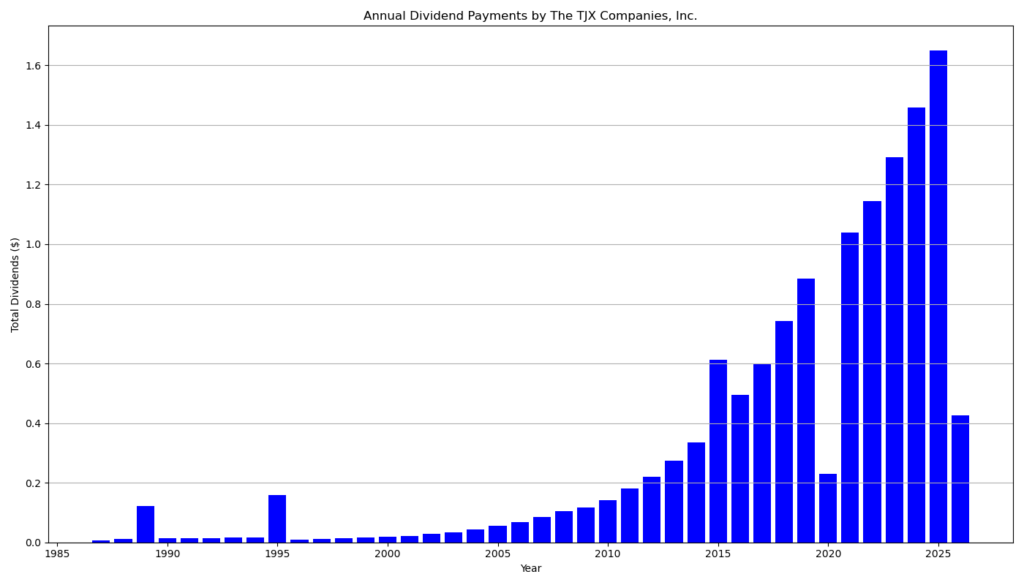
Dividend history and sustainability
TJX has paid dividends for 36 consecutive years and achieved five consecutive years of dividend growth in its current streak. Over the long term, the dividend has expanded at a compound annual growth rate of approximately 20%. Historical data shows a consistent pattern of stepwise increases, with only rare interruptions.
Sustainability remains high due to strong free cash flow, moderate payout ratios, and resilient off-price retail demand. The business model generates stable margins even in volatile consumer environments. However, dividend growth may moderate if earnings growth decelerates or if capital allocation shifts more heavily toward buybacks.
Outlook for long-term investors
TJX continues to benefit from structural advantages in off-price retail. The company leverages opportunistic buying, rapid inventory turnover, and global sourcing to sustain margin expansion. Comparable sales growth of around 5% and rising earnings per share underline operational strength .
Management guides for moderate growth in fiscal 2027, with expected EPS between roughly $4.93 and $5.02 . This outlook suggests continued, but slower, earnings expansion. For dividend investors, TJX represents a dividend growth stock rather than a high-yield vehicle. The relatively low yield reflects the company’s premium valuation and reinvestment capacity.
Risks include cyclical consumer demand, margin pressure from inventory cost fluctuations, and elevated valuation multiples. Nonetheless, the combination of earnings growth, disciplined capital returns, and strong cash flow supports a favorable long-term profile.
A brief company profile
The TJX Companies, Inc. is a leading off-price retailer in the consumer cyclical sector. The company operates more than 5,200 stores across multiple international markets, including banners such as TJ Maxx, Marshalls, HomeGoods, and TK Maxx. TJX focuses on branded merchandise at discounted prices, typically 20% to 60% below traditional retail levels. This value-driven model enables consistent traffic generation and market share expansion across economic cycles.
last quarterly report*
1. Financial Performance
Revenue (Net Sales)
- Q4: $17.7B, +9% YoY
- FY2026: $60.4B, +7% YoY
Comparable Sales
- Q4: +5%
- Full year: +5%
Net Income
- Q4: $1.8B (vs. $1.4B prior year)
- FY2026: $5.5B (vs. $4.9B prior year)
Earnings Per Share (EPS)
- Q4: $1.58, +28% YoY
- FY2026: $4.87, +14% YoY
Adjusted EPS (excluding one-off effects):
- Q4: $1.43 (+16%)
- FY2026: $4.73 (+11%)
2. Profitability
Pretax Margin
- Q4: 13.5% (up from 11.6%)
- FY2026: 12.1% (up from 11.5%)
Adjusted Pretax Margin
- Q4: 12.2%
- FY2026: 11.7%
Gross Margin
- Q4: 30.9%
- FY2026: 31.0%
Key drivers:
- Higher merchandise margins
- Expense leverage (cost efficiency)
- Lower inventory shrink
3. Cash Flow & Balance Sheet
Operating Cash Flow
- FY2026: $6.9B
Cash Position
- $6.2B at year-end
Inventory
- $7.3B (up from $6.4B)
Debt
- Long-term debt reduced to $1.87B (from $2.87B)
Interpretation:
- Strong liquidity and cash generation
- Balance sheet improving (lower leverage)
4. Shareholder Returns
Total capital returned FY2026
- $4.3B
- $2.5B share buybacks
- $1.8B dividends
Quarterly dividend
- $0.425 (vs. $0.375 prior year)
Planned dividend increase
- Target: $0.48 per share (+13%)
Buyback outlook
- FY2027: $2.5B–$2.75B planned
5. Segment & Operational Performance
Sales growth by division (Q4)
- Marmaxx (U.S.): +5%
- HomeGoods: +6%
- Canada: +7%
- International: +4%
Store footprint
- 5,214 stores globally (+129 YoY)
6. One-Time Effects (Important Adjustment)
- Litigation settlement added ~$221M to profit
- Boosted EPS by ~$0.14–$0.15
Critical note:
- Reported margins and EPS are inflated by this non-recurring gain
- Adjusted figures give a more accurate operating picture
7. Outlook (FY2027)
- Comparable sales: +2% to +3%
- EPS: $4.93–$5.02
- Pretax margin: ~11.7%–11.8%
8. Key Takeaways for Dividend Investors
Strengths
- Consistent comp sales growth (5%)
- Strong free cash flow (~$6.9B)
- Increasing dividend (+13% planned)
- Aggressive buybacks
- Improving margins
Risks / Considerations
- Growth is moderating (guidance: 2–3%)
- One-time gains distort headline profitability
- Inventory increased significantly (+~14%)
- Retail sector remains cyclical
Bottom Line
TJX delivered strong operational execution with solid sales growth, expanding margins, and high cash generation. The company continues to prioritize shareholder returns through dividends and buybacks.
However, underlying growth is moderating, and part of the earnings strength is non-recurring, which should temper expectations.
*This is the latest quarterly report that the company has filed with the SEC.
Next Earnings Date: 5/20/2026 7:00 AM
Die Selektion dieser Aktie erfolgte zufällig aus einem breiten Spektrum an tagesaktuellen Börsenmitteilungen bezüglich angekündigter Dividendenzahlungen. Der vorliegende Beitrag zielt nicht auf eine qualitative Bewertung dieser dividendenstarken Aktie ab, sondern verfolgt einen rein deskriptiven Ansatz.
Was sind Dividend Champions, Contenders, Challengers?
Disclaimer: Dieser Bericht dient ausschließlich Informationszwecken und stellt keine Anlageberatung oder Empfehlung zum Kauf oder Verkauf von Wertpapieren dar. Für die Richtigkeit der Daten wird keine Gewähr übernommen.