
Latest dividend announcement
EMCOR Group, Inc. declared a regular quarterly cash dividend of $0.40 per share for April 2026. The company maintains its prior payout level, confirming a stable distribution policy. The dividend will be paid on April 30, 2026, to shareholders of record as of April 16, 2026, with the ex-dividend date set for the same day.
Details of the dividend distribution
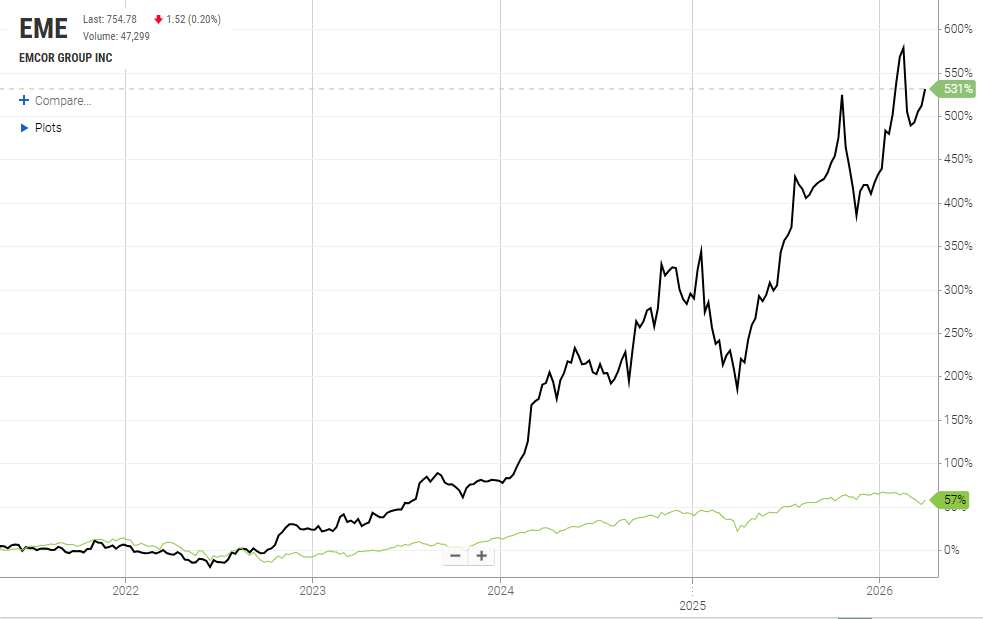
The quarterly dividend of $0.40 translates into an annualized payout of $1.60 per share. Based on the current share price of approximately $755, the forward dividend yield stands at roughly 0.21%. This yield remains significantly below the broader market average, reflecting EMCOR’s capital allocation strategy, which prioritizes reinvestment and share repurchases over income distribution. The company’s payout ratio is notably low at approximately 3.6%, indicating that only a small fraction of earnings is distributed to shareholders. This conservative payout structure provides substantial flexibility for future dividend growth or strategic investments.
Relevant valuation metrics
EMCOR exhibits strong profitability and growth metrics. The company generated approximately $16.99 billion in annual revenue and reported EBITDA of about $1.76 billion, corresponding to an EBITDA margin of roughly 10.4%. Earnings per share reached $28.19 on a trailing basis, with forward EPS estimated at $31.29. The stock trades at a forward P/E ratio of approximately 24.1 and a trailing P/E of about 26.8, which suggests a premium valuation relative to traditional industrial peers. Free cash flow amounts to nearly $1.0 billion, supporting both internal reinvestment and shareholder returns. The enterprise value stands near $33.0 billion, implying an EV/EBITDA multiple of approximately 18.7. These metrics indicate a high-quality growth profile, but they also limit the attractiveness of the stock for yield-focused investors.
Dividend history and sustainability
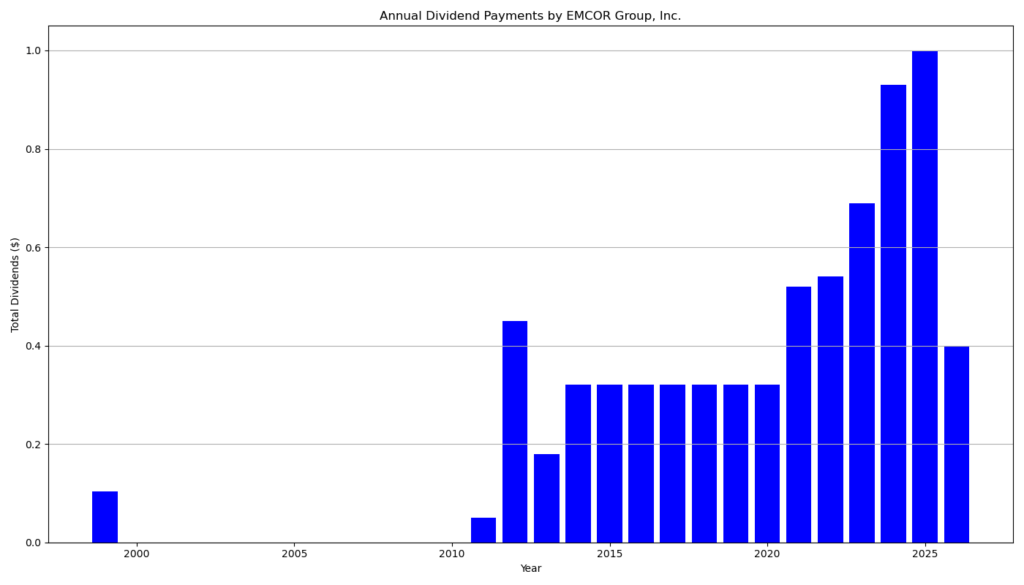
EMCOR has paid dividends consistently for 14 consecutive years and has increased its dividend for five consecutive years. However, the current announcement confirms no increase compared to the previous quarter. In 2025, the company paid total dividends of $1.00 per share, which indicates that the current annualized rate of $1.60 reflects a meaningful step-up over the past year. The low payout ratio and strong earnings growth—over 50% year-over-year—support a highly sustainable dividend. The company retains significant earnings capacity, which reduces the risk of dividend cuts even under adverse market conditions.
Outlook for long-term investors
EMCOR’s investment case centers on earnings growth rather than income generation. The company benefits from strong demand in infrastructure, data centers, and industrial construction, supported by a record backlog exceeding $13 billion . Revenue growth of nearly 20% and expanding operating margins underline operational efficiency and pricing power. However, investors should critically assess valuation levels, as the current multiples already price in continued growth. The low dividend yield limits immediate income appeal, but the combination of high free cash flow and minimal payout obligations creates substantial optionality for future capital returns.
Company profile
EMCOR Group, Inc. operates as a leading provider of mechanical and electrical construction services, industrial infrastructure solutions, and building services. The company focuses on complex, large-scale projects across sectors such as manufacturing, energy, and commercial construction. As a Fortune 500 and S&P 500 constituent, EMCOR leverages technical expertise and project execution capabilities to drive consistent revenue and earnings growth.
last quarterly report*
Here is a concise summary of the EMCOR Group Q4 and full-year 2025 report:
Overall performance
- EMCOR delivered record results in 2025, with strong growth across revenue, earnings, and backlog.
- The company benefited from solid demand across multiple end markets and strong project execution.
Revenue
- Q4 2025 revenue: $4.51 billion (+19.7% YoY)
- Full-year 2025 revenue: $16.99 billion (+16.6% YoY)
- Organic growth was lower but still solid (Q4: +9.5%, FY: +7.9%), indicating acquisitions contributed meaningfully.
Profitability
- Q4 net income: $434.6 million (EPS $9.68) vs. $292.2 million prior year
- Full-year net income: $1.27 billion (EPS $28.19) vs. $1.01 billion
- Margins improved:
- Q4 operating margin: 12.7% (up from 10.3%)
- FY operating margin: 10.1% (up from 9.2%)
Adjusted (non-GAAP) results
- Q4 EPS adjusted: $7.19
- FY EPS adjusted: $25.87
- Adjustments mainly reflect the gain from selling UK operations and transaction-related costs.
Cash flow and financial position
- Operating cash flow (FY 2025): $1.30 billion
- Cash declined slightly to $1.11 billion, partly due to acquisitions and share repurchases.
- The balance sheet remains solid with growing equity (~$3.67 billion).
Backlog / future demand
- Remaining performance obligations (backlog): $13.25 billion, up 31% YoY
- Growth driven by sectors such as communications, infrastructure, and industrial projects.
Segment insights
- Core growth comes from:
- Electrical construction (30% of revenue)
- Mechanical construction (42%)
- These segments also deliver the highest margins (~12–13%).
Dividend
- Annual dividend increased to $1.00 per share (from $0.93)
- Indicates moderate but consistent dividend growth.
2026 outlook
- Revenue guidance: $17.75–$18.50 billion
- EPS guidance: $27.25–$29.25
- Slight margin normalization expected (9.0–9.4%).
Key takeaway
However, part of the earnings boost is non-recurring (UK divestiture), so underlying profitability is slightly lower than headline figures suggest.
EMCOR shows strong cyclical and structural growth, high backlog visibility, and improving margins.
*This is the latest quarterly report that the company has filed with the SEC.
Next Earnings Date: 4/29/2026 7:00 AM
Die Selektion dieser Aktie erfolgte zufällig aus einem breiten Spektrum an tagesaktuellen Börsenmitteilungen bezüglich angekündigter Dividendenzahlungen. Der vorliegende Beitrag zielt nicht auf eine qualitative Bewertung dieser dividendenstarken Aktie ab, sondern verfolgt einen rein deskriptiven Ansatz.
Was sind Dividend Champions, Contenders, Challengers?
Disclaimer: Dieser Bericht dient ausschließlich Informationszwecken und stellt keine Anlageberatung oder Empfehlung zum Kauf oder Verkauf von Wertpapieren dar. Für die Richtigkeit der Daten wird keine Gewähr übernommen.