
Latest dividend announcement
Enterprise Products Partners declared a quarterly cash distribution of $0.55 per unit for the first quarter of 2026. The distribution remains unchanged compared to the previous quarter but reflects a 2.8% increase versus the $0.535 paid in the first quarter of 2025. The company will pay the distribution on May 14, 2026, to unitholders of record as of April 30, 2026, with the ex-dividend date also set for April 30.
Details of the dividend distribution
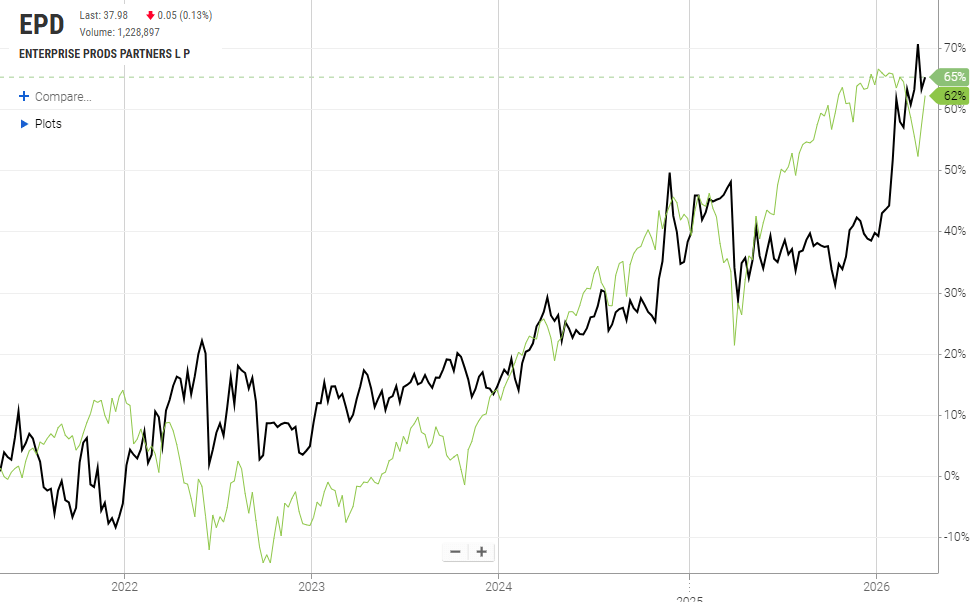
The quarterly payout of $0.55 corresponds to an annualized distribution of $2.20 per unit. Based on the current unit price of approximately $38, the forward yield stands near 5.7% to 5.9%, positioning Enterprise among the higher-yielding large-cap midstream operators. The company continues to supplement distributions with capital returns through buybacks, repurchasing $116 million of common units in the first quarter of 2026. This dual capital allocation approach enhances total unitholder return while preserving balance sheet flexibility.
Relevant valuation metrics
Enterprise Products Partners maintains a market capitalization of approximately $83 billion and an enterprise value of roughly $117 billion. The units trade at a price-to-earnings ratio of 14.5 and a forward P/E of 12.1, indicating moderate valuation relative to expected earnings growth. The distribution yield near 5.8% compares favorably to peers and fixed-income alternatives.
From a cash flow perspective, the partnership generated $7.9 billion in distributable cash flow in 2025, covering distributions by a strong 1.7x ratio . This level of coverage remains a critical metric for income investors, as it signals substantial excess cash generation. The payout ratio based on earnings stands at approximately 82%, which appears elevated but aligns with the MLP structure, where distributable cash flow provides a more relevant benchmark. Enterprise also delivered adjusted free cash flow of about $3.1 billion, supporting reinvestment and capital returns.
Dividend history and sustainability
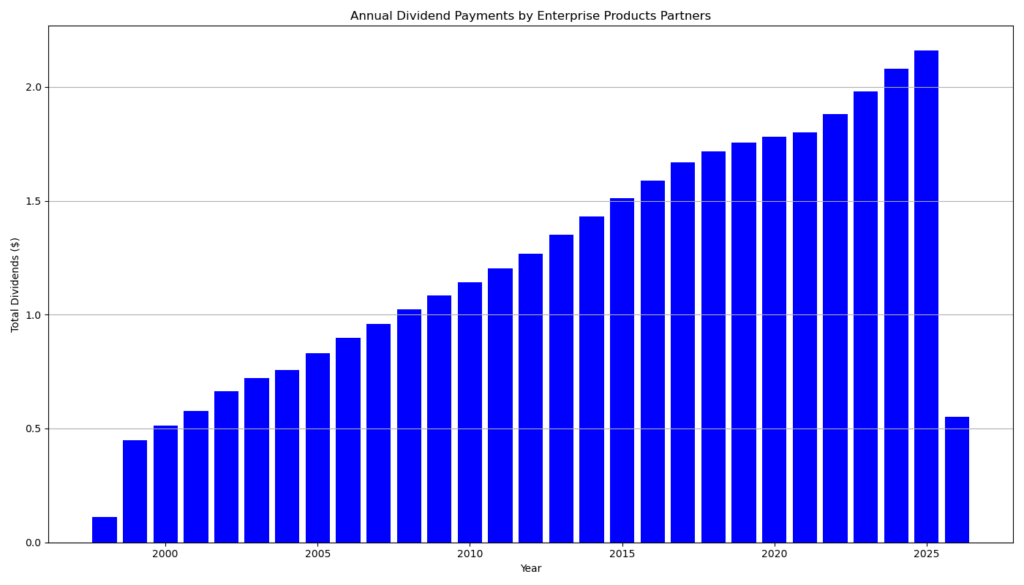
Enterprise Products Partners has increased its distribution for 27 consecutive years. The growth trajectory remains gradual but consistent. Quarterly distributions rose from $0.50 in 2023 to $0.55 in early 2026, reflecting a steady compound growth rate in the low single digits. Over the past three to five years, distribution growth averaged roughly 4% annually.
The sustainability of this distribution profile relies on stable fee-based cash flows. Enterprise’s midstream business model generates predictable income through long-term contracts, limiting direct exposure to commodity price volatility. The partnership retained approximately $3.2 billion of cash flow in 2025 after distributions, reinforcing its ability to fund capital expenditures and maintain balance sheet discipline.
Outlook for long-term investors
Enterprise’s investment case centers on income stability rather than rapid capital appreciation. The combination of high distribution yield, strong coverage ratio, and disciplined capital allocation supports a durable income stream. Earnings growth expectations of approximately 8% annually over the next five years provide moderate upside potential.
However, investors should monitor leverage levels and capital intensity. Total debt remains elevated at over $34 billion, which is typical for the sector but requires ongoing cash flow stability. The planned reduction in growth capital expenditures to approximately $2.0 billion annually could improve free cash flow generation and support further distribution increases.
Overall, Enterprise offers a defensive income profile with limited volatility, supported by a beta of 0.52 and consistent operational performance.
A brief company profile
Enterprise Products Partners L.P. is one of the largest publicly traded midstream energy partnerships in North America. The company operates an integrated network of more than 50,000 miles of pipelines and extensive storage and processing facilities. Its asset base spans natural gas, natural gas liquids, crude oil, refined products, and petrochemicals. Enterprise focuses on fee-based services, including transportation, storage, processing, and export infrastructure, which generate stable and recurring cash flows.
last quarterly report*
Enterprise Products Partners (EPD) – FY 2025 & Q4 Summary
1. Earnings & Profitability
- Net income (2025): $5.8 billion (slightly down from $5.9 billion in 2024)
- EPS (2025): $2.66 vs. $2.69 in 2024
- Q4 net income: $1.6 billion (flat YoY)
Interpretation:
Earnings remained stable but showed mild pressure year-over-year. This indicates resilience but limited growth at the bottom line.
2. Cash Flow (Key for Dividends)
- Operational DCF (2025): $7.9 billion (unchanged YoY)
- DCF coverage ratio: 1.7× (very strong)
- Retained DCF: $3.2 billion
- Q4 DCF coverage: 1.8×
Interpretation:
Cash flow is the core strength. Coverage above 1.5× signals a highly secure distribution with substantial retained capital for reinvestment.
3. Dividend / Distribution
- 2025 distribution: $2.175 per unit (+3.6% YoY)
- Q4 distribution: $0.55 per unit (+2.8% YoY)
- Track record: 27 consecutive years of growth
Interpretation:
This is a classic slow-growth, high-reliability income profile. Growth is modest but consistent and well-covered.
4. Free Cash Flow & Capital Allocation
- Adjusted FCF (2025): $3.13 billion (slightly down from $3.17 billion)
- Buybacks (2025): $300 million
- Payout ratio (incl. buybacks): 58% of CFFO
Interpretation:
The payout ratio is conservative for a midstream MLP. This leaves flexibility for:
- debt reduction
- growth investments
- continued distribution increases
5. Balance Sheet & Liquidity
- Total debt: $34.7 billion
- Liquidity: $5.2 billion
Interpretation:
Leverage is significant in absolute terms, but typical for capital-intensive midstream operators. Strong cash flow mitigates risk.
6. Growth Investments
- Total capital investment (2025): $5.6 billion
- 2026 expected growth capex: $1.9–$2.3 billion
Key projects:
- Bahia NGL pipeline (already operational)
- Expansion in Permian Basin infrastructure
Interpretation:
Growth is increasingly capital-disciplined, with lower forward capex suggesting improving free cash flow potential.
7. Operational Performance
(From tables on pages 2 and 10)
- Pipeline volumes and processing volumes increased across most segments
- Record levels in:
- Natural gas processing
- NGL fractionation
- Pipeline throughput
Interpretation:
Operational momentum remains strong despite weaker commodity prices. Volume growth is a key driver of stable cash flows.
Overall Assessment for Dividend Investors
Strengths
- Very strong distribution coverage (1.7–1.8×)
- Long-term 27-year growth track record
- Stable, fee-based midstream business model
- High retained cash for reinvestment
Weaknesses / Risks
- Minimal earnings growth
- High absolute debt level
- Exposure to energy volumes and long-term demand trends
Conclusion
Enterprise Products Partners remains a high-quality income vehicle rather than a growth stock. The combination of stable cash flow, conservative payout, and consistent distribution growth supports long-term dividend sustainability. The key variable to monitor is whether volume growth continues to offset macro pressure from commodity cycles.
*This is the latest quarterly report that the company has filed with the SEC.
Next Earnings Date:
Die Selektion dieser Aktie erfolgte zufällig aus einem breiten Spektrum an tagesaktuellen Börsenmitteilungen bezüglich angekündigter Dividendenzahlungen. Der vorliegende Beitrag zielt nicht auf eine qualitative Bewertung dieser dividendenstarken Aktie ab, sondern verfolgt einen rein deskriptiven Ansatz.
Was sind Dividend Champions, Contenders, Challengers?
Disclaimer: Dieser Bericht dient ausschließlich Informationszwecken und stellt keine Anlageberatung oder Empfehlung zum Kauf oder Verkauf von Wertpapieren dar. Für die Richtigkeit der Daten wird keine Gewähr übernommen.