
Latest Dividend Announcement
Somnigroup International Inc. has declared a quarterly cash dividend of $0.17 per share. The new payout reflects a 13.3% increase from the previous quarterly dividend of $0.15. The dividend is payable on March 19, 2026, to shareholders of record as of March 5, 2026. The ex-dividend date is March 5, 2026. Based on the current share price of $89.35, the forward dividend yield stands at approximately 0.71%.
Details of the Dividend Distribution
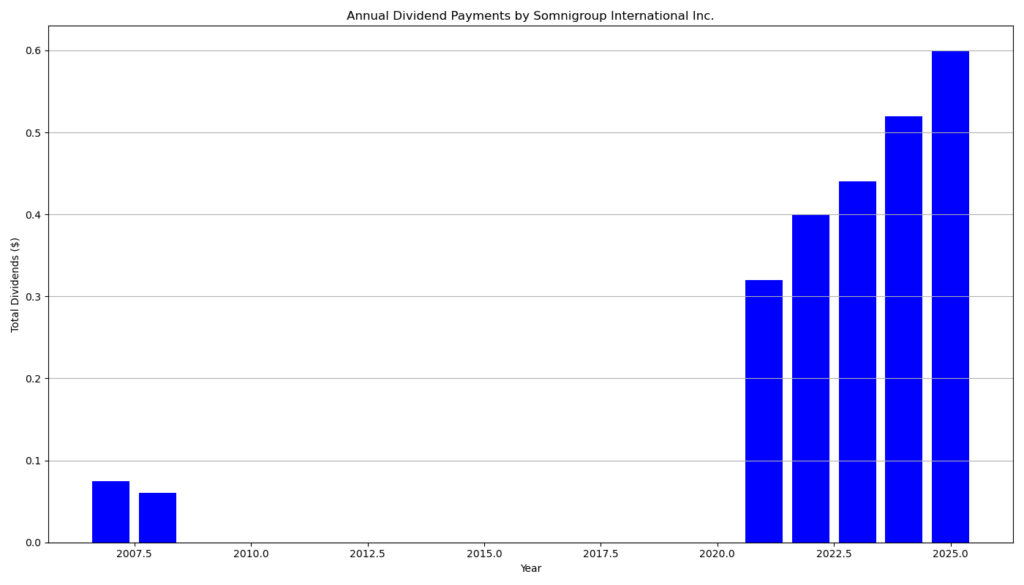
The new annualized dividend amounts to $0.68 per share, compared with the prior annualized run rate of $0.60. The trailing annual dividend totals $0.58, which reflects the phased increases implemented during 2025. Management has now raised the dividend six times in the past five years. Since initiating the modern dividend policy in 2021 at $0.07 per quarter, Somnigroup has more than doubled its quarterly payout. The current dividend level implies a payout ratio of approximately 36.7% based on forward earnings estimates. This ratio positions the company in a moderate distribution range that balances shareholder returns with reinvestment capacity.
Relevant Valuation Metrics
Somnigroup currently carries a market capitalization of about $18.8 billion. The enterprise value stands at approximately $26.7 billion, reflecting total debt of $6.6 billion and limited cash reserves of roughly $0.1 billion. The forward price-to-earnings ratio is 22.2, based on forward EPS of $4.03. The trailing P/E remains elevated at 56.5 due to prior earnings volatility, but earnings growth of 13.7% and quarterly earnings growth of 36.5% indicate accelerating profitability.
The company generated approximately $622 million in free cash flow and reported EBITDA of about $853 million, corresponding to an EBITDA margin of 12.5%. The forward dividend of $0.68 consumes a manageable portion of projected earnings and free cash flow. However, the enterprise value-to-EBITDA multiple of 31.3 suggests a premium valuation relative to many consumer cyclical peers. Investors must therefore weigh growth prospects against valuation compression risk.
Dividend History and Sustainability
Somnigroup has delivered four consecutive years of dividend growth and four uninterrupted years of dividend payments under its current policy. After suspending distributions between 2009 and 2020, the company reinstated its dividend in 2021. Since then, quarterly payments increased from $0.07 to $0.17. Notable step-ups occurred in 2022, 2024, 2025, and now 2026.
The current payout ratio below 40% supports sustainability under stable earnings conditions. Free cash flow coverage also appears adequate. Nevertheless, the balance sheet carries over $6.6 billion in total debt. This leverage level requires continued EBITDA expansion and disciplined capital allocation to preserve dividend flexibility during cyclical downturns.
Outlook for Long-Term Investors
Somnigroup operates in the consumer cyclical sector, specifically furnishings and bedding. Revenue growth of 63.3% reflects integration effects and market share gains. The company maintains a beta of 1.28, indicating above-market volatility. Long-term dividend investors should expect earnings sensitivity to housing trends, discretionary spending, and financing conditions.
The forward yield remains modest at below 1%. Therefore, the investment thesis centers more on dividend growth and capital appreciation than on immediate income generation. Analyst price targets cluster around $105, implying potential upside if earnings momentum continues.
Investors should monitor leverage metrics, margin expansion, and free cash flow conversion. Sustained double-digit earnings growth would support further dividend increases. A cyclical slowdown, however, could pressure valuation multiples and limit near-term payout acceleration.
Brief Company Profile
Somnigroup International Inc., headquartered in Dallas, operates as the world’s largest bedding manufacturer. The company controls leading brands such as Tempur-Pedic, Sealy, Stearns & Foster, and Sleepy’s. It distributes products in more than 100 countries through a vertically integrated platform that includes manufacturing, wholesale distribution, and retail operations such as Mattress Firm and Dreams. Its omni-channel infrastructure and brand portfolio position the company as a dominant player in the global sleep solutions market.
last quarterly report*
1. Revenue & Comparable Sales
Q3 FY26
- Sales: $1.392 billion (+3.1% YoY)
- Same-store sales (SSS): +3.0%
Year-to-date (39 weeks)
- Sales: $4.469 billion (+2.7% YoY)
- SSS: +2.5%
Interpretation for Dividend Investors
Positive same-store sales growth after prior declines is important because:
- It signals stabilization in consumer demand.
- It supports operating leverage and margin expansion.
- It reduces risk of dividend pressure during cyclical downturns.
However, management explicitly mentions a “measured consumer environment” and softer confidence in Q4 guidance, which indicates demand remains fragile.
2. Profitability & Margins
Q3 FY26
- Gross margin: 37.3% (↑ 130 bps YoY)
- Operating income: $23.9M (vs. $9.2M last year)
- Operating margin: 1.7% (vs. 0.7%)
- Adjusted operating income: $32.0M (vs. $16.2M)
- Adjusted operating margin: 2.3%
Drivers
- Higher merchandise margins
- Services growth
- Fixed cost leverage
- Higher AUR (Average Unit Retail) +7%
Interpretation
Margin expansion is more important than revenue growth for dividend sustainability. The improvement is encouraging because:
- Pricing power is offsetting higher gold costs and tariffs.
- Gross margin expansion improves cash generation capacity.
- Operating income more than doubled YoY.
However, operating margins remain thin (1.7% GAAP). Jewelry retail is structurally cyclical and margin-sensitive, so dividend investors should demand consistent multi-quarter margin stability.
3. Earnings Per Share (EPS)
Q3 FY26
- Diluted EPS: $0.49 (vs. $0.12 last year)
- Adjusted diluted EPS: $0.63 (vs. $0.24)
Year-to-date
- Diluted EPS: $1.06 (vs. –$3.07 last year)
- Adjusted diluted EPS: $3.41 (vs. $2.62)
Interpretation
EPS growth is strong and supported by:
- Higher operating income
- Lower share count (buybacks)
- Reduced impairment charges vs. prior year
For dividend investors:
- Earnings recovery reduces payout risk.
- Share repurchases amplify per-share dividend sustainability.
But note: prior year comparisons were distorted by impairments and preferred share redemption effects, so some improvement is normalization rather than pure operational strength.
4. Free Cash Flow (Critical for Dividends)
Q3 (13 weeks)
- Operating cash flow: $31.0M
- Capex: $32.5M
- Free cash flow: –$1.5M
Year-to-date (39 weeks)
- Operating cash flow: –$58.0M (improved from –$189.8M)
- Capex: –$93.1M
- Free cash flow: –$151.1M
Interpretation
This is the most important area of scrutiny.
Despite earnings growth:
- Year-to-date free cash flow is still negative.
- Q3 free cash flow was roughly breakeven.
Dividend sustainability depends on consistent positive free cash flow, not adjusted EPS.
However:
- Cash balance improved to $234.7M (vs. $157.7M YoY).
- Inventory declined 1% YoY.
- Working capital management improved materially.
The holiday quarter (Q4) is seasonally the largest cash generator. Dividend investors should monitor whether Q4 converts accounting earnings into real cash.
5. Balance Sheet & Debt
Key Points
- Cash: $234.7M
- Long-term debt: $0 (vs. $253M last year)
- Inventory: $2.11B (–1% YoY)
- Total shareholders’ equity: $1.72B
Interpretation
This is a major positive:
- The company has eliminated long-term debt.
- Balance sheet risk is significantly reduced.
- Financial flexibility for dividends and buybacks improved.
For dividend investors, debt reduction is often more valuable than short-term dividend increases.
6. Capital Returns
Share Repurchases
- Q3: $28M
- YTD: $178M
- $545M authorization remaining
Dividend
- Quarterly dividend: $0.32 per share
- YTD dividends declared: $0.96 per share
- Prior year: $0.87 YTD
Dividend growth: ~10% increase YoY (0.29 → 0.32 quarterly).
Interpretation
Dividend growth while free cash flow is negative YTD is aggressive.
Estimated payout ratio (rough):
- Using YTD adjusted EPS $3.41
- Annualized dividend ≈ $1.28
- Payout ratio ≈ 38%
On an earnings basis, payout appears conservative.
On a free cash flow basis, it is less comfortable.
Buybacks + dividends + negative FCF is only sustainable if Q4 delivers strong seasonal cash inflow.
7. Guidance
FY26 Adjusted EPS: $8.43–$9.59
Raised from prior guidance.
FY26 Adjusted Operating Income: $465–$515M
Raised at low end.
However:
- Q4 same-store sales guidance: –5% to +0.5%
- Reflects consumer softness and tariff impacts.
Interpretation
Guidance improvement supports dividend stability. But Q4 revenue range suggests management is cautious.
Dividend investors should watch:
- Holiday conversion rates
- Consumer confidence trends
- Margin durability under tariff pressure
8. Overall Dividend Investment Assessment
Strengths
- Same-store sales returned to growth
- Gross margin expansion
- Debt eliminated
- Dividend increased
- Share count reduced
- Improved adjusted earnings outlook
Risks
- Free cash flow still negative YTD
- Jewelry retail is discretionary and cyclical
- Margins remain structurally thin
- Q4 outlook cautious
- High inventory relative to quarterly sales
Bottom Line for Dividend Investors
Signet is transitioning from a restructuring/impairment-heavy period into a recovery phase.
The dividend appears:
- Sustainable on an earnings basis
- Supported by balance sheet strength
- Backed by management confidence (increase + buybacks)
However, the real test is Q4 cash generation. Until consistent positive free cash flow is demonstrated, this remains a moderate-risk cyclical dividend story, not a defensive income stock.
*This is the latest quarterly report that the company has filed with the SEC.
Die Selektion dieser Aktie erfolgte zufällig aus einem breiten Spektrum an tagesaktuellen Börsenmitteilungen bezüglich angekündigter Dividendenzahlungen. Der vorliegende Beitrag zielt nicht auf eine qualitative Bewertung dieser dividendenstarken Aktie ab, sondern verfolgt einen rein deskriptiven Ansatz.
Was sind Dividend Champions, Contenders, Challengers?