Latest dividend announcement
Standex International Corporation declared a quarterly cash dividend of $0.34 per share. The new dividend remains in line with the previous quarterly payment of $0.34. On a year-over-year basis, it stands about 6.3% above the prior-year level.
Details of the dividend distribution
The dividend will be paid on May 22, 2026. Shareholders of record on May 8, 2026 will receive the payment. The stock also trades ex-dividend on May 8, 2026. Based on the current share price of about $274.79, the forward dividend yield stands near 0.49%.
Relevant valuation metrics
Standex carries a market capitalization of about $3.33 billion and an enterprise value of about $3.86 billion. The stock trades at a high trailing P/E ratio of 61.5, while the forward P/E falls to 27.4. This gap signals strong expected earnings growth.
The company generated trailing sales of about $868.6 million and net income of $53.9 million. Its price-to-sales ratio stands at 3.8, while EV/EBITDA sits at 21.3. These levels indicate a premium valuation. Investors therefore need continued earnings growth to justify the current multiple.
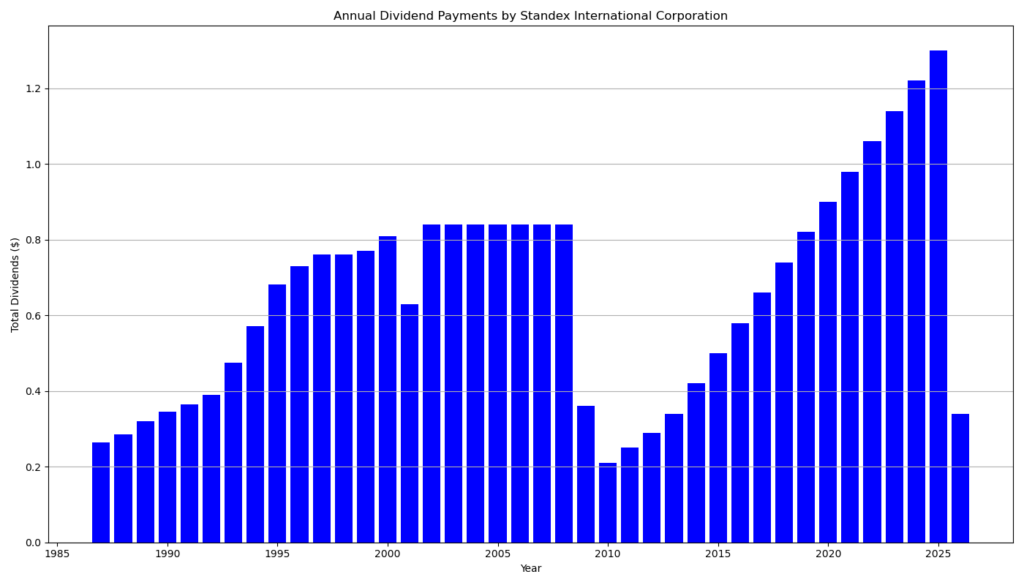
Dividend history and sustainability
Standex has now declared its 247th consecutive quarterly cash dividend. The company has paid quarterly dividends since it became public in November 1964. The record shows a long dividend culture, but not a perfectly uninterrupted growth record over the full period.
Recent dividend growth looks consistent. The quarterly dividend rose from $0.30 in 2024 to $0.32 in late 2024, and then to $0.34 in late 2025. The current payment keeps that higher level intact. The company has recorded 15 consecutive years of dividend growth and 36 consecutive years of dividend payments, according to the supplied dividend history data.
The payout ratio stands near 27.2%. That level looks conservative. It leaves room for reinvestment, acquisitions, debt service, and future dividend increases. Free cash flow remains an important watch item, however, because the stock trades at about 64.5 times free cash flow. A low dividend yield also means most shareholder return expectations depend on capital appreciation, not current income.
Outlook for long-term investors
Standex offers a dividend profile built on consistency, not high yield. The company targets growth through electronics, engineering technologies, scientific products, engraving, and specialty solutions. Recent sales momentum remains strong, with trailing sales growth above 21% and quarterly sales growth of 16.6%. Analysts expect EPS growth next year, which supports the forward valuation case.
The main risk sits in valuation. A premium multiple limits the margin of safety. Long-term investors should focus on organic growth, margin expansion, free cash flow conversion, and leverage discipline.
A brief company profile
Standex International is a global multi-industry manufacturer. It operates through Electronics, Engineering Technologies, Scientific, Engraving, and Specialty Solutions. The company serves markets across the United States, Europe, Canada, Japan, Singapore, Mexico, Turkey, India, and China. Its global footprint and diversified industrial base support recurring cash generation and its long-standing dividend policy.
last quarterly report*
Standex International – Q2 FY2026 Summary
- Revenue growth: Sales rose 16.6% YoY to $221.3 million, with 6.4% organic growth. Growth was driven by new products and strong demand in “fast growth markets,” which contributed ~28% of total sales.
- Profitability:
- GAAP operating income increased sharply to $35.6 million (from $8.5 million).
- Adjusted operating margin improved slightly to 19.0%.
- Net income surged to $20.6 million, reflecting a large YoY increase due to prior-year distortions.
- Earnings per share:
- GAAP EPS: $0.17 (up from $0.07).
- Adjusted EPS: $2.08 (up ~9%).
- Cash flow: Free cash flow improved significantly to $13.0 million (vs. $2.2 million last year), indicating stronger cash generation.
- Balance sheet:
- Net debt stands at roughly $437.7 million.
- Leverage improved to 2.3x EBITDA, down from 2.9x.
- Dividend: Quarterly dividend increased to $0.34 per share, up ~6.3% YoY.
- Segment performance:
- Electronics (largest segment) grew strongly (+20.6% revenue, strong margins).
- Engineering Technologies benefited mainly from acquisitions.
- Scientific showed weak organic demand.
- Engraving delivered solid double-digit growth.
- Specialty Solutions declined.
- Outlook:
- Management expects continued mid-to-high single-digit organic growth.
- Full-year revenue projected to increase by >$110 million, supported by new products and fast-growth markets.
Bottom line:
Standex delivered strong top-line growth and sharply improved profitability, supported by product innovation and high-growth markets. Cash flow and leverage trends improved, and the company continues modest but consistent dividend growth.
*This is the latest quarterly report that the company has filed with the SEC.
Next Earnings Date: 5/4/2026 After close
Die Selektion dieser Aktie erfolgte zufällig aus einem breiten Spektrum an tagesaktuellen Börsenmitteilungen bezüglich angekündigter Dividendenzahlungen. Der vorliegende Beitrag zielt nicht auf eine qualitative Bewertung dieser dividendenstarken Aktie ab, sondern verfolgt einen rein deskriptiven Ansatz.
Was sind Dividend Champions, Contenders, Challengers?
Disclaimer: Dieser Bericht dient ausschließlich Informationszwecken und stellt keine Anlageberatung oder Empfehlung zum Kauf oder Verkauf von Wertpapieren dar. Für die Richtigkeit der Daten wird keine Gewähr übernommen.