
Latest dividend announcement
Walmart’s board approved an annual cash dividend of $0.99 per share for fiscal 2027. The new level represents a 5.3% increase versus the prior annual dividend of $0.94. The company also authorized a new $30 billion share repurchase program. Management framed the decision as part of a balanced capital return strategy and highlighted a multi-decade record of uninterrupted dividend growth.
Details of the dividend distribution
Walmart will pay the $0.99 annual dividend in four quarterly installments of $0.2475 per share. The schedule follows a regular quarterly cadence:
- Payable April 6, 2026 (record and ex-dividend: March 20, 2026)
- Payable May 26, 2026 (record and ex-dividend: May 8, 2026)
- Payable September 8, 2026 (record and ex-dividend: August 21, 2026)
- Payable January 4, 2027 (record and ex-dividend: December 11, 2026)
At a share price near $126, the forward dividend implies a yield around 0.8%. That yield positions Walmart as a dividend growth and capital-return name, not as an income-heavy equity.
Relevant valuation metrics
Walmart trades at a premium valuation versus many consumer defensive peers. The market capitalization sits near $1.01 trillion, with an enterprise value around $1.07 trillion. The stock shows a forward P/E near 38 and a trailing P/E above 40, which embeds optimistic assumptions about earnings durability and margin progression. The company also trades at roughly 10x book value, a level that limits valuation support if growth slows.
On operating cash generation, fiscal 2026 produced $41.6 billion of operating cash flow and $14.9 billion of free cash flow. Walmart also reported $10.7 billion of cash and $51.5 billion of total debt under its reporting definition. Some market data feeds show higher “total debt” because they aggregate additional lease and financing items. Investors should reconcile definitions before drawing leverage conclusions.
Dividend history and sustainability
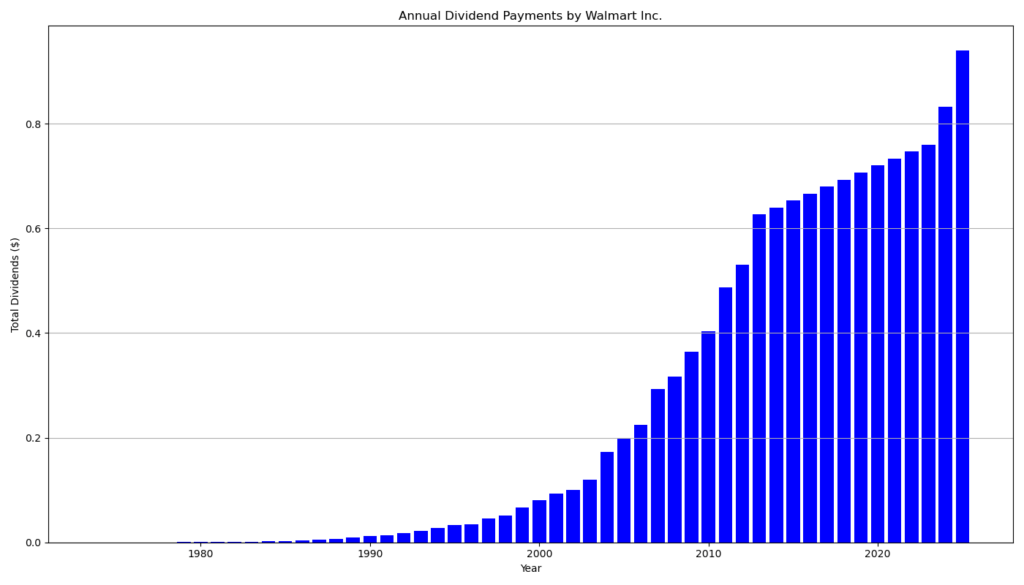
The dividend matters because it signals confidence in durable cash generation. Walmart now marks its 53rd consecutive year of dividend increases, which places it among the longest-running dividend growers in U.S. large caps.
Recent payment history shows modest but steady step-ups. Quarterly dividends moved from $0.190 in 2023 to $0.208 in 2024 and $0.235 in 2025. Those figures translate to annualized dividends of about $0.76, $0.83, and $0.94. The new $0.99 annual level continues that pattern.
Sustainability looks solid under multiple lenses. A payout ratio around low-30% based on forward earnings leaves buffer for reinvestment and buybacks. Free cash flow also covers the dividend with room to spare, even after sizable capital expenditures that support omnichannel expansion.
A critical point remains. Walmart’s yield stays low. The company must rely on consistent dividend growth and repurchases to deliver attractive shareholder yield. The $30 billion authorization strengthens that case, but it also increases the importance of disciplined buyback timing at elevated multiples.
Outlook for long-term investors
Walmart combines scale, defensive demand, and improving digital economics. Management highlighted strong eCommerce momentum and expanding higher-margin revenue streams such as advertising and membership fees. These levers can lift operating leverage over time.
The risk sits in expectations. A premium multiple can compress if earnings growth normalizes or if capex requirements stay structurally high. Long-term dividend investors should treat Walmart as a low-yield, high-quality compounder. The investment thesis works best when the buyer accepts modest current income in exchange for durability, incremental dividend growth, and steady per-share value accretion through repurchases.
A brief company profile
Walmart Inc. operates a global omnichannel retail platform across stores, eCommerce, and mobile. The business serves roughly 280 million weekly customers and members through more than 10,900 locations across 19 countries. Fiscal 2026 revenue reached about $713 billion, supported by a broad mix of consumables, general merchandise, and membership-led formats.
last quarterly report*
Walmart delivered solid top-line growth in Q4 and fiscal 2026, with operating performance improving faster than revenue.
Revenue and Earnings Performance
In Q4 FY26, total revenue rose 5.6% to $190.7 billion . For the full fiscal year, revenue increased 4.7% to $713.2 billion . This level of growth is notable given Walmart’s already massive revenue base and reflects continued market share gains.
Operating income in Q4 increased 10.8% to $8.7 billion , outpacing revenue growth. For the full year, operating income rose 1.6% to $29.8 billion . On an adjusted basis, operating income grew 5.4% in FY26 . The faster growth in operating income relative to sales signals margin expansion and improved cost control—an important indicator of underlying earnings power.
GAAP diluted EPS for FY26 came in at $2.73, up from $2.41 in FY25 . Adjusted EPS reached $2.64 . For dividend investors, EPS growth directly supports dividend capacity and sustainability.
Cash Flow and Financial Strength
Walmart generated $41.6 billion in operating cash flow in FY26, up $5.1 billion year over year . Free cash flow reached $14.9 billion, an increase of $2.3 billion . Strong and growing free cash flow is critical for funding dividends, share repurchases, and capital expenditures without overleveraging the balance sheet.
The company ended the year with $10.7 billion in cash and cash equivalents and total debt of $51.5 billion . Given its scale and stable cash generation, Walmart’s leverage profile remains manageable.
Dividend and Capital Allocation
Walmart increased its annual dividend to $0.99 per share in FY26, up from $0.94 in FY25 . This marks continued dividend growth, supported by rising earnings and free cash flow.
With adjusted EPS of $2.64, the payout ratio stands at roughly 38%. This conservative payout ratio leaves ample room for future dividend increases and reinvestment into the business.
In addition, Walmart repurchased $8.1 billion of shares in FY26 and announced a new $30 billion share repurchase authorization . Share buybacks enhance per-share metrics and complement dividend growth.
Return Metrics and Efficiency
Return on assets improved to 8.2% from 7.9% , reflecting stronger profitability. However, return on investment declined slightly to 15.1% from 15.5% due to higher invested capital. While still robust, the slight decline suggests that incremental capital deployment has not yet fully translated into proportional return expansion.
Strategic and Operational Drivers
Global eCommerce grew 24% in Q4 , and advertising revenue rose sharply. These higher-margin digital segments support long-term margin expansion. Comparable sales in Walmart U.S. increased 4.6% , demonstrating continued consumer demand and pricing power.
Outlook
For FY27, management guides for net sales growth of 3.5% to 4.5% and adjusted EPS of $2.75 to $2.85 . This implies continued earnings growth, which should sustain further dividend increases.
Overall, Walmart combines scale, consistent cash generation, disciplined capital allocation, and moderate payout ratios. For dividend investors, the company offers stability, predictable growth, and a strong foundation for long-term compounding.
*This is the latest quarterly report that the company has filed with the SEC.
Die Selektion dieser Aktie erfolgte zufällig aus einem breiten Spektrum an tagesaktuellen Börsenmitteilungen bezüglich angekündigter Dividendenzahlungen. Der vorliegende Beitrag zielt nicht auf eine qualitative Bewertung dieser dividendenstarken Aktie ab, sondern verfolgt einen rein deskriptiven Ansatz.
Was sind Dividend Champions, Contenders, Challengers?