NACCO Industries recently declared a regular quarterly cash dividend of $0.2525 per share. The board of directors maintained the distribution at the exact level of the previous quarter. Shareholders of record at the close of business on March 2, 2026, will collect the payment on March 16, 2026. The stock trades ex-dividend on March 2, 2026. This financial distribution directly benefits holders of both Class A and Class B Common Stock.
At the current market price, the stock provides a forward dividend yield of 1.81%. NACCO Industries currently trades at a trailing price-to-earnings ratio of 14.26. The firm also trades at a price-to-book ratio of 0.98. This specific valuation metric indicates a slight discount to the underlying net asset value. The enterprise commands a market capitalization of $0.42 billion alongside an enterprise value of $0.45 billion. Over the trailing twelve months, total revenue reached $0.28 billion. The company exhibits strong top-line momentum across its core operations. Recent quarterly financial reports show revenue expanding by over 24% year-over-year. Increased customer requirements at the Mississippi Lignite Mining Company facility and higher parts sales in the Contract Mining segment primarily drove this robust top-line expansion.
Management actively maintains a highly conservative balance sheet. The firm holds $0.05 billion in total cash and cash equivalents. Total debt currently stands at a highly manageable $0.09 billion. This capital structure translates to a very low overall debt-to-capitalization ratio. This exceptionally strong liquidity position gives the company a substantial financial buffer against unexpected macroeconomic headwinds.
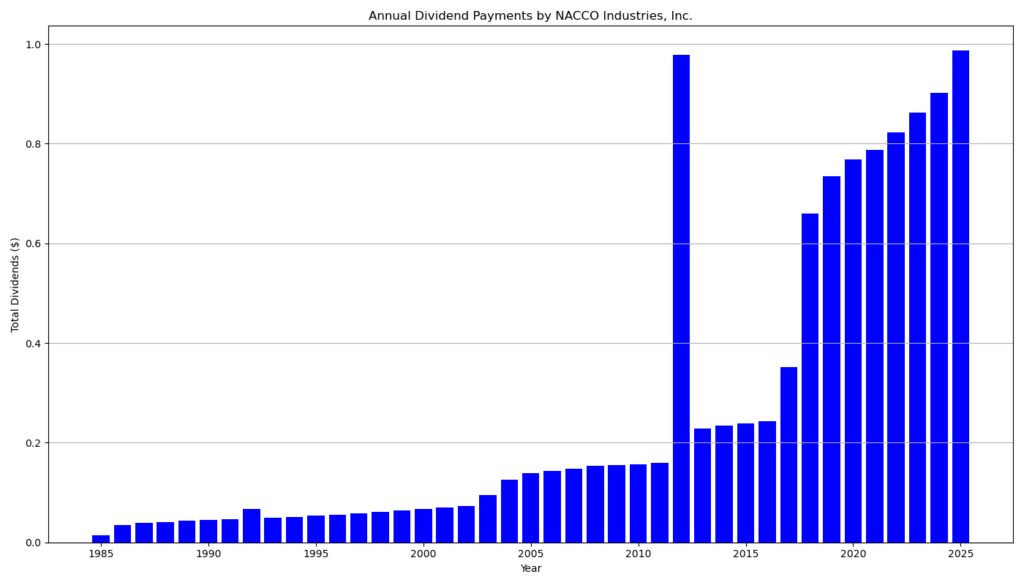
NACCO Industries possesses an outstanding long-term dividend track record. The company has disbursed uninterrupted dividends for 39 consecutive years. Furthermore, management has successfully grown the annual dividend payout for 12 consecutive years. While the company kept the current $0.2525 payout flat compared to the immediate prior quarter, this specific rate represents a solid 11% year-over-year growth trajectory compared to early 2025 levels.
The dividend demonstrates exceptional sustainability metrics. The firm reports a highly conservative payout ratio of 24.55% based on trailing earnings. The company generated $3.91 in trailing earnings per share. This low distribution level leaves ample capital for strategic business reinvestments and ongoing debt management. While recent capital expenditures temporarily pressured free cash flow generation, the firm still produced positive free cash flow over the preceding nine-month period. The massive cash pile completely secures the dividend distribution against any short-term operational shortfalls.
Long-term investors acquire a highly resilient income-generating asset in this equity. The modest payout ratio and the low corporate leverage protect the quarterly distribution during potential economic downturns. Management consistently demonstrates a steadfast commitment to returning capital to shareholders through steady dividends and strategic share repurchases. The combination of sustainable yield, consistent historical dividend growth, and low valuation multiples offers a highly attractive profile for value-oriented income investors. Shareholders can anticipate steady, recurring cash flows as the enterprise continues executing its long-term mining and royalty contracts.
NACCO Industries operates as a strategically diversified natural resources enterprise. The company extracts and delivers aggregates, minerals, reliable fuels, and comprehensive environmental solutions. Management oversees a robust portfolio of industrial operations through the NACCO Natural Resources division. These strategic operations generate dependable, annuity-like returns through specialized contract mining and mineral royalty management across the United States. The business model utilizes long-term contracts to create a predictable layering effect for future cash flows.
last quarterly report*
Based on the provided Q3 2025 Form 10‑Q for NACCO Industries, Inc. (NC), here is an analysis of the key financial metrics relevant to retail dividend investors, along with an interpretation of what these numbers mean and why they matter.
1. Key Metrics & Interpretation from the Q3 2025 Report
Revenue
- Q3 2025: $76.6 million, up 24.3% from $61.7 million in Q3 2024.
- First 9 Months of 2025: $210.4 million, up 25.8% from $167.3 million in 2024.
- Interpretation: The company is experiencing strong top-line growth. The report notes this was primarily driven by an increase in customer requirements at its Mississippi Lignite Mining Company (MLMC) facility and increased part sales in its Contract Mining segment.
Earnings Per Share (EPS)
- Q3 2025 (Diluted): $1.78, down from $2.14 in Q3 2024.
- First 9 Months of 2025 (Diluted): $2.87, down from $3.54 in 2024.
- Interpretation: Despite revenue growth, profitability dropped year-over-year. The company noted this was largely due to the absence of a one-time business interruption insurance recovery ($13.6 million) they received in Q3 2024, as well as higher employee-related expenses and a lower contractual sales price per ton at MLMC.
Free Cash Flow (FCF)
- First 9 Months of 2025: $5.16 million. (Calculated as Operating Cash Flow of $39.50 million minus Capital Expenditures of $34.34 million).
- Interpretation: This is a massive improvement from the first 9 months of 2024, where operating cash flow was negative (-$2.88 million). The company generated $5.16 million in free cash flow to fund dividends, share repurchases, and debt reduction.
Debt & Balance Sheet Health
- Total Debt: $80.16 million (Includes current maturities, long-term debt, and revolving credit).
- Cash & Cash Equivalents: $52.66 million.
- Debt to Total Capitalization: 16% (down from 20% at the end of 2024).
- Interpretation: NACCO has a very conservative balance sheet. With $52.6 million in cash offsetting $80.1 million in debt, their “net debt” is highly manageable, and their debt-to-capitalization ratio of 16% indicates very low leverage.
Dividend Per Share & Dividend Growth
- Current Quarterly Dividend: $0.2525 per share.
- Dividend Growth: The company raised its dividend in Q2 2025 from $0.2275 to $0.2525 per share. This represents a healthy 11% year-over-year increase in the quarterly payout.
- Interpretation: Management is actively returning growing value to shareholders.
Payout Ratio
- EPS Payout Ratio (First 9 Months): ~25.5%. (Total dividends declared in the first 9 months were $0.7325 per share / $2.87 diluted EPS).
- FCF Payout Ratio (First 9 Months): ~105%. (The company paid $5.45 million in total cash dividends against $5.16 million in FCF).
- Interpretation: From an accounting (EPS) standpoint, the dividend is extremely safe, taking up just a quarter of net income. While Free Cash Flow narrowly missed covering the total dividend payout over the 9‑month period, the company’s massive cash pile ($52.6 million) means the dividend is in absolutely no danger of being cut.
Dividend Yield
- Note: Because stock prices fluctuate daily, the SEC filing does not provide the current dividend yield. However, you can calculate it using the **annualized dividend of
1.01∗∗(1.01** (1.01∗∗(0.2525 x 4 quarters) divided by the stock’s current market price.
2. Why These Metrics Matter to Dividend Investors
Dividend Growth: Inflation erodes purchasing power. A company that consistently raises its dividend (like NACCO’s recent 11% hike) ensures that an investor’s passive income grows faster than the cost of living.
Revenue & EPS: These are the engines of the company. Without long-term growth in sales (revenue) and profitability (EPS), a company cannot sustainably grow its dividend. A falling EPS can be a warning sign, though in NACCO’s case, it was largely due to a one-time insurance payout heavily boosting the prior year’s numbers.
Free Cash Flow (FCF): Earnings are an accounting metric; dividends are paid in hard cash. FCF represents the actual cash a company has left over after maintaining and expanding its business (CapEx). Dividend investors prefer companies that easily cover their dividend payouts with FCF.
Debt Levels: When the economy slows down, companies with high debt loads are often forced to cut their dividends to meet strict debt repayment obligations. NACCO’s low debt-to-capital ratio (16%) acts as a protective moat around its dividend.
Payout Ratio: This shows how much of a company’s profits or cash are going toward dividends. A low payout ratio (like NACCO’s ~25% EPS payout) means the dividend is safe from short-term business downturns and has plenty of room to grow in the future. Conversely, a ratio over 100% means a company is paying out more than it earns, which is a red flag if sustained over several years.
*This is the latest quarterly report that the company has filed with the SEC.
Die Selektion dieser Aktie erfolgte zufällig aus einem breiten Spektrum an tagesaktuellen Börsenmitteilungen bezüglich angekündigter Dividendenzahlungen. Der vorliegende Beitrag zielt nicht auf eine qualitative Bewertung dieser dividendenstarken Aktie ab, sondern verfolgt einen rein deskriptiven Ansatz.
Was sind Dividend Champions, Contenders, Challengers?