Latest dividend announcement
The Ensign Group, Inc. has declared a quarterly cash dividend of $0.065 per share, maintaining the same level as the previous distribution. The healthcare services provider announced the dividend on March 23, 2026.
The dividend corresponds to an annualized payout of $0.26 per share. Based on the current share price of approximately $202.77, the stock offers a forward dividend yield of roughly 0.13%.
The payment is scheduled for April 30, 2026. Shareholders must be on record as of March 31, 2026, which also marks the ex-dividend date.
Details of the dividend distribution
The latest dividend matches the previous quarterly payment of $0.065, which the company introduced with the December 2025 distribution. The payout therefore remains stable compared with the prior quarter.
With four quarterly payments per year, Ensign’s dividend policy results in a total annual distribution of $0.26 per share. Although the absolute yield remains modest relative to traditional income stocks, the company maintains a highly conservative payout structure.
The dividend payout ratio stands at roughly 4.3% of earnings, based on current financial data. Such a low payout level signals that the company retains the vast majority of its earnings for reinvestment, acquisitions, and operational expansion.
Relevant valuation metrics
Ensign currently holds a market capitalization of approximately $11.8 billion. The company operates in the medical care facilities industry within the healthcare sector.
Several valuation indicators highlight the company’s growth-oriented profile:
The stock trades at a forward price-to-earnings ratio of about 24.6, based on projected earnings per share of $8.24. The trailing P/E ratio is significantly higher at around 34.7, reflecting strong earnings growth expectations.
The company generates annual revenue of approximately $5.06 billion, with EBITDA of roughly $529 million and an EBITDA margin slightly above 10%.
Free cash flow currently totals about $281 million, which comfortably covers the annual dividend obligation due to the extremely low payout ratio. Ensign also maintains solid liquidity with $572 million in cash on the balance sheet.
Enterprise value stands near $13.3 billion, implying an EV/EBITDA multiple of about 25.2, a valuation typical for healthcare operators with strong growth trajectories.
Dividend history and sustainability
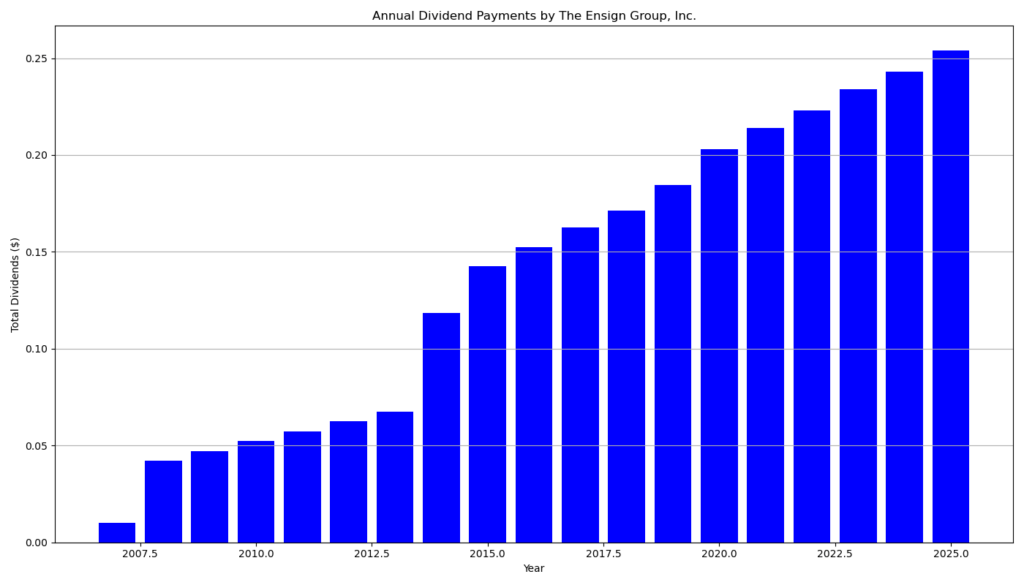
Ensign has built a consistent dividend record over the past two decades. The company has paid dividends for 18 consecutive years and achieved 18 consecutive years of dividend growth.
The dividend trajectory illustrates gradual but consistent increases. Quarterly payouts rose from $0.0102 in 2007 to $0.065 today, representing more than a sixfold increase over the period.
More recently, the company raised the quarterly dividend from $0.058 in 2023 to $0.060 in 2024, followed by $0.063 in early 2025 and the current $0.065 level introduced at the end of 2025.
This steady progression demonstrates a disciplined capital allocation strategy that combines growth investments with gradually rising shareholder distributions.
Because the dividend consumes only a small fraction of earnings, the company retains significant flexibility to continue increasing the payout over time while funding acquisitions and expansion.
Outlook for long-term investors
For long-term investors, Ensign represents a growth-oriented dividend stock rather than a high-yield income vehicle.
The company continues to deliver robust operating momentum. Revenue growth recently exceeded 20%, while earnings growth remains near 18% annually. These figures suggest continued expansion across its healthcare services platform.
Given the minimal payout ratio, Ensign possesses substantial capacity to increase its dividend in future years. If earnings growth persists, the company could gradually scale its distributions without compromising reinvestment or financial stability.
However, the stock’s current valuation reflects these growth expectations. Investors therefore rely primarily on earnings expansion and capital appreciation, with dividends serving as a secondary but steadily growing component of total return.
Company profile
The Ensign Group, Inc. is a U.S.-based healthcare services provider headquartered in San Juan Capistrano, California. The company operates a network of skilled nursing facilities, senior living communities, and rehabilitation services across multiple states.
Its business model focuses on post-acute healthcare services, including skilled nursing care, assisted living, and specialized therapy programs. Ensign also owns healthcare real estate through affiliated entities that lease properties to operating subsidiaries.
Through a strategy centered on acquisitions, operational improvements, and decentralized management, Ensign has expanded into one of the larger operators in the U.S. post-acute care sector.
With strong revenue growth, conservative leverage, and a long record of dividend increases, the company remains positioned as a long-term compounder within the healthcare services industry.
last quarterly report*
Summary: The Ensign Group – FY 2025 Annual Report
1. Financial Performance
The Ensign Group reported strong revenue and earnings growth in 2025.
- Total revenue: $5.06 billion (2025) vs. $4.26 billion (2024)
- Net income: $344.3 million (2025) vs. $298.5 million (2024)
- Diluted EPS: $5.84 vs. $5.12 in the prior year
Revenue increased by roughly 18.7% year-over-year, primarily driven by higher patient occupancy, improved reimbursement mix, and newly acquired facilities.
Operating income reached $425.3 million, while net margin was approximately 6.8% of revenue.
2. Key Business Drivers
Growth was mainly supported by expansion in the company’s skilled nursing operations.
Key operational metrics:
- Skilled services revenue: $4.84 billion (+18.7%)
- Facilities operated: 326 facilities (up from 286)
- Patient days: 10.8 million (+14.5%)
- Occupancy rate: 82.2% (up from 80.5%)
Improved occupancy and a higher share of skilled-care patients increased revenue per patient day and profitability.
Acquisitions also contributed meaningfully. Recently acquired facilities generated $653 million in revenue, reflecting rapid expansion of the company’s footprint.
3. Segment Performance
The company operates primarily through two segments:
Skilled Services
- Revenue: $4.84 billion
- Segment income: $616 million
This segment includes skilled nursing facilities and post-acute care services and remains the dominant revenue source.
Standard Bearer (Real Estate)
- Rental revenue: $126.9 million (+33.5%)
- Funds from operations (FFO): $75.2 million (+28.3%)
Growth resulted from real-estate acquisitions and rent increases within the company’s healthcare property portfolio.
4. Profitability and Non-GAAP Metrics
Management also reports several non-GAAP performance measures:
- EBITDA: $543 million
- Adjusted EBITDA: $602 million
- Adjusted EBITDAR: $842 million
These metrics reflect operational profitability before rent and certain non-recurring items and are widely used in the healthcare facility industry.
5. Balance Sheet and Liquidity
The company maintained a relatively conservative balance sheet.
Key figures (end of 2025):
- Total assets: $5.46 billion
- Total equity: $2.23 billion
- Long-term debt: about $137.5 million
The company also had access to a $600 million credit facility with no outstanding borrowings at year-end, providing significant liquidity flexibility.
Cash and equivalents totaled $503.9 million.
6. Cash Flow
Operating performance generated strong cash flow.
- Operating cash flow: $564 million
- Investing cash flow: –$513 million (mainly acquisitions and capital expenditures)
Cash generation increased significantly compared with the prior year due to stronger operations and improved collections.
7. Shareholder Returns
The company has a long dividend history:
- It has paid dividends since 2002.
- Dividend increases have occurred every year for 23 consecutive years.
In 2025 the company also repurchased $20 million of shares under a stock buyback program.
8. Overall Assessment
The 2025 results show:
- Strong revenue growth driven by acquisitions and occupancy improvements.
- Expanding facility network and patient volumes.
- Healthy margins and cash generation.
- Moderate leverage with substantial liquidity.
The Ensign Group continues to expand its skilled nursing and post-acute care platform while maintaining a consistent dividend growth record.
*This is the latest quarterly report that the company has filed with the SEC.
Next Earnings Date: 4/28/2026 After close
Die Selektion dieser Aktie erfolgte zufällig aus einem breiten Spektrum an tagesaktuellen Börsenmitteilungen bezüglich angekündigter Dividendenzahlungen. Der vorliegende Beitrag zielt nicht auf eine qualitative Bewertung dieser dividendenstarken Aktie ab, sondern verfolgt einen rein deskriptiven Ansatz.
Was sind Dividend Champions, Contenders, Challengers?