Latest dividend announcement
Phillips 66 declared a quarterly dividend of $1.27 per share, unchanged from the previous distribution. The dividend will be paid on June 1, 2026, to shareholders of record as of May 18, 2026, with the same date as the ex-dividend date. The forward annualized dividend amounts to approximately $5.08 per share, implying a forward yield of about 3.25% at current price levels.
Details of the dividend distribution
The current payout remains stable compared to the prior quarter, when the company also distributed $1.27 per share. This follows an increase implemented in early 2026, when the dividend rose from $1.20 to $1.27, representing a step-up of roughly 5.8%. The unchanged level indicates a pause in dividend growth rather than a reversal. The company maintains a consistent quarterly distribution schedule, supporting predictable cash income for shareholders.
Relevant valuation metrics
Phillips 66 operates with a market capitalization of approximately $62.5 billion and an enterprise value of about $84.1 billion. The stock trades at a price-to-earnings ratio of 14.4 and a forward P/E of 10.6, signaling expectations of earnings growth. The dividend payout ratio stands at 44%, which remains moderate for a cyclical energy business and leaves room for reinvestment and balance sheet management.
Profitability metrics show return on equity of 15.6% and return on invested capital of 9.0%, indicating solid capital efficiency. However, margins remain structurally thin, with a net profit margin of 3.3% and operating margin of 2.5%, reflecting the commodity-driven nature of refining and downstream operations. Free cash flow valuation appears less attractive, with a price-to-free-cash-flow ratio near 23, suggesting sensitivity to earnings cycles.
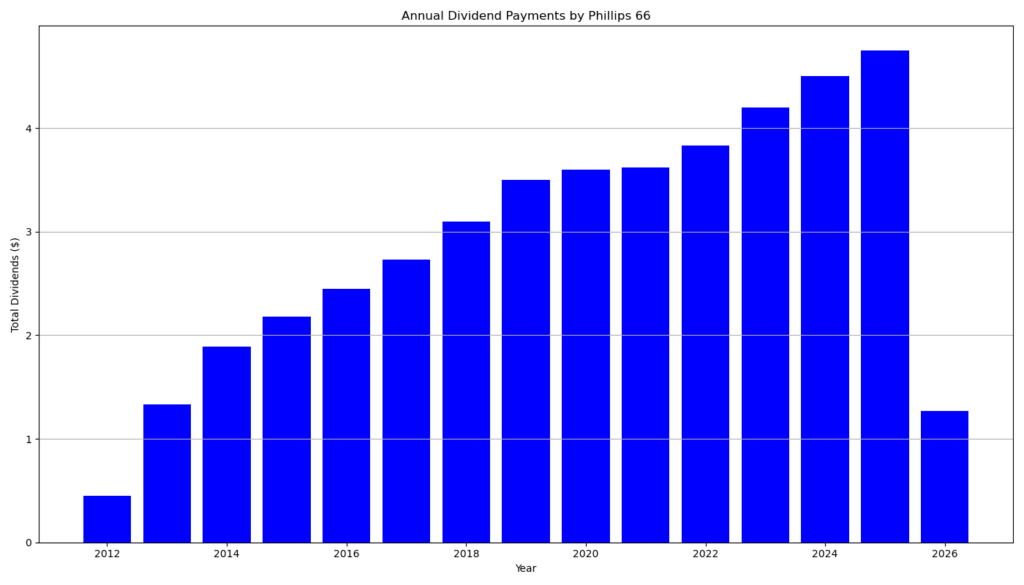
Dividend history and sustainability
Phillips 66 has delivered 13 consecutive years of dividend growth and uninterrupted payments over the same period. The dividend increased from $0.97 in 2022 to $1.15 in 2024 and reached $1.27 in 2026. This trajectory implies a mid-single-digit compound annual growth rate, broadly aligned with the reported 3- to 5‑year dividend growth rates of 5–7%.
The current payout ratio near 44% supports sustainability, even in volatile earnings environments. However, the company’s exposure to refining margins and commodity price swings introduces variability in cash flow generation. Balance sheet leverage remains manageable, with a debt-to-equity ratio of 0.74, but absolute debt levels remain elevated in cyclical downturns.
Outlook for long-term investors
Phillips 66 combines a stable dividend profile with cyclical earnings exposure. The forward earnings multiple suggests the market anticipates improved profitability, supported by an expected EPS increase to roughly $14.72 next year. At the same time, near-term earnings volatility remains evident, with projected quarterly losses linked to commodity price effects.
For dividend-focused investors, the key variables are refining margins, midstream stability, and capital allocation discipline. The current yield above 3% offers moderate income, while the established growth track record supports long-term compounding. However, investors should account for earnings cyclicality and potential pressure on free cash flow during adverse market conditions.
A brief company profile
Phillips 66 is a diversified downstream energy company headquartered in Houston, Texas. The company operates across Midstream, Chemicals, Refining, Marketing and Specialties, and Renewable Fuels segments. It generates annual revenue of over $132 billion and employs approximately 12,600 people. As a constituent of the S&P 500, the company plays a significant role in global energy supply chains, with a strategic focus on operational efficiency and a gradual transition toward lower-carbon energy solutions.
last quarterly report*
Summary of Phillips 66 Q1 2026 Preliminary Guidance
Phillips 66 reported that its first-quarter 2026 results will be materially impacted by market-related and operational factors, based on preliminary estimates.
Key financial impacts
- The company expects approximately $900 million in pre-tax mark-to-market losses due to rising commodity prices. These losses reflect derivative positions and are not offset by the increased value of physical inventories.
- Segment-level impacts show losses across refining, marketing, and renewable fuels, with refining alone facing up to $450 million in losses.
Segment performance (pre-tax income/loss estimates)
- Midstream: Strongest segment, generating $550–600 million profit.
- Chemicals: Modest profit of $80–130 million.
- Refining: Significant loss of $200–400 million.
- Marketing & Specialties: Near break-even to $170 million loss.
- Renewable Fuels: Loss of $50–150 million.
- Corporate & Other: Large loss of $450–470 million.
Operational headwinds
- Refining margins were negatively affected by pricing lag effects (~$300 million).
- Midstream faced disruptions from winter weather and higher depreciation.
- Chemicals utilization declined due to reduced operations in Middle East joint ventures.
- Marketing margins were pressured by rapidly rising spot prices.
Liquidity and balance sheet
- Commodity price volatility caused a $3 billion cash outflow for collateral on derivatives.
- The company raised liquidity via debt and credit facilities.
- As of March 31, 2026:
- Liquidity: ~$6 billion (including ~$5 billion cash)
- Total debt: ~$27 billion
- Net debt: ~$22 billion
- Management maintains a target to reduce debt to $17 billion by 2027.
Operational outlook
- Refining utilization improved to mid-90%.
- Chemicals utilization slightly declined to low-90%.
- Turnaround expenses remain stable.
Bottom line
Phillips 66’s Q1 outlook reflects strong midstream performance offset by substantial losses in refining and derivatives exposure. Liquidity remains adequate, but leverage is elevated, and earnings are highly sensitive to commodity price volatility.
*This is the latest quarterly report that the company has filed with the SEC.
Next Earnings Date: 4/29/2026 7:00 AM
Die Selektion dieser Aktie erfolgte zufällig aus einem breiten Spektrum an tagesaktuellen Börsenmitteilungen bezüglich angekündigter Dividendenzahlungen. Der vorliegende Beitrag zielt nicht auf eine qualitative Bewertung dieser dividendenstarken Aktie ab, sondern verfolgt einen rein deskriptiven Ansatz.
Was sind Dividend Champions, Contenders, Challengers?
Disclaimer: Dieser Bericht dient ausschließlich Informationszwecken und stellt keine Anlageberatung oder Empfehlung zum Kauf oder Verkauf von Wertpapieren dar. Für die Richtigkeit der Daten wird keine Gewähr übernommen.