Latest Dividend Announcement
Dillard’s, Inc. (NYSE: DDS) declared a quarterly cash dividend of $0.30 per share on its Class A and Class B common stock. The dividend remains in line with the previous quarterly distribution of $0.30. The company therefore maintains its current payout level and does not raise the regular dividend this quarter.
Details of the Dividend Distribution
Dillard’s will pay the dividend on May 4, 2026. Shareholders of record as of March 31, 2026 will receive the payment. The ex-dividend date is March 31, 2026.
Based on a current share price of $602.79, the annualized dividend amounts to $1.20 per share. This results in a forward dividend yield of approximately 0.2%. The trailing annual dividend rate stands at $1.10, reflecting the increase to $0.30 per quarter implemented in the second half of 2025.
Relevant Valuation Metrics
Dillard’s reports a market capitalization of approximately $9.4 billion. The enterprise value totals about $9.1 billion, implying moderate net cash after accounting for $1.07 billion in total cash and $557.6 million in total debt.
The stock trades at a trailing P/E ratio of 16.6 and a forward P/E of 18.5, based on forward EPS of $32.60. The price-to-book ratio stands at 5.29, with a book value of $113.94 per share. Enterprise value to EBITDA is 10.4, while EBITDA reached roughly $868 million, corresponding to an EBITDA margin of 13.2%.
Free cash flow amounts to approximately $502 million. With annual dividend obligations of roughly $19 million based on the current share count, the free cash flow coverage ratio exceeds 25x. The payout ratio stands at only 3.0% of earnings. This extremely conservative payout profile leaves significant financial flexibility.
However, revenue declined by about 3% year over year to $6.56 billion, and earnings growth turned slightly negative. Earnings quarterly growth stands at ‑5%. Investors must therefore weigh valuation against cyclical pressure in the department store sector.
Dividend History and Sustainability
Dillard’s demonstrates a long record of capital returns. The company has paid dividends for 28 consecutive years and has increased its regular dividend for 15 consecutive years.
The regular quarterly dividend rose from $0.25 to $0.30 in September 2025, marking a 20% step-up at that time. The current declaration confirms that higher baseline.
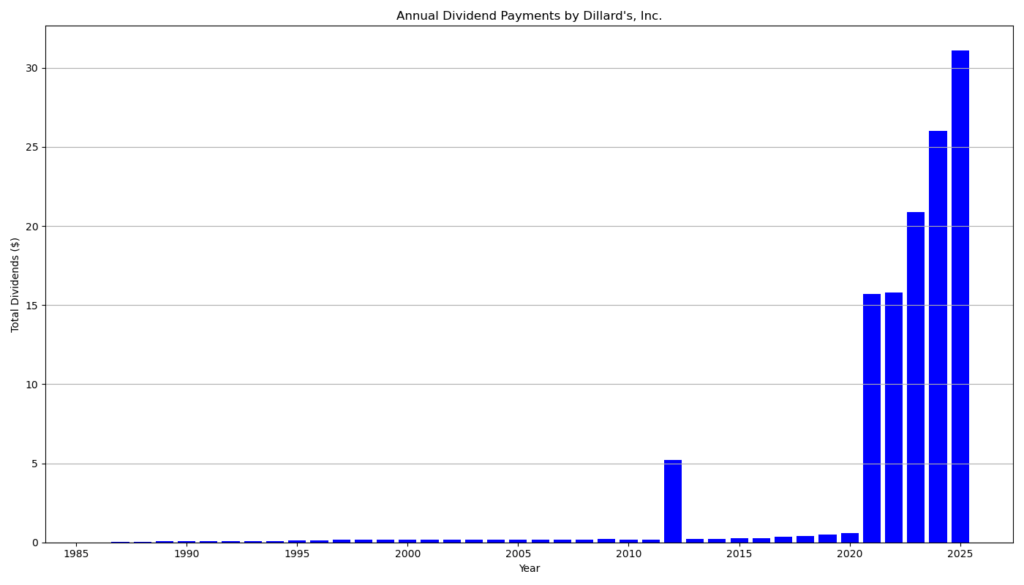
In addition to the regular dividend, Dillard’s has distributed substantial special dividends in recent years. These included $15.00 in 2021, $15.00 in 2022, $20.00 in 2023, $25.00 in 2024, and $30.00 in December 2025. These extraordinary payments significantly enhanced total shareholder yield but remain discretionary.
Given the low payout ratio, strong free cash flow, and net cash position, the regular dividend appears highly secure under current operating conditions. The key risk factor remains cyclical volatility in discretionary retail demand.
Outlook for Long-Term Investors
Dillard’s combines conservative balance sheet management with disciplined capital allocation. The company generated over $500 million in free cash flow and maintains over $1 billion in cash. Management also continues share repurchases, further enhancing per-share metrics.
The low regular dividend yield limits immediate income appeal. However, the company’s history of special dividends and buybacks increases total shareholder return potential. Long-term investors who tolerate earnings volatility may benefit from this flexible capital return model.
Future dividend growth will likely depend on margin stability and sustained free cash flow generation in a challenging retail environment characterized by competitive pressure and shifting consumer behavior.
A Brief Company Profile
Dillard’s, Inc., headquartered in Little Rock, Arkansas, operates in the Consumer Cyclical sector within the Department Stores industry. The company generates approximately $6.6 billion in annual revenue and operates a nationwide network of department stores alongside its e‑commerce platform. Dillard’s focuses on apparel, cosmetics, accessories, and home merchandise, targeting middle- to upper-income consumers across the United States.
last quarterly report*
Here is a structured summary of Dillard’s fiscal year and fourth quarter 2025/2026 results based on the company’s filing :
Overview
Dillard’s reported a stable but slightly weaker fiscal year compared to the prior year. Sales were essentially flat, while earnings declined modestly. The company maintained strong margins and a solid liquidity position, and it returned significant capital to shareholders through dividends and share repurchases.
Fiscal Year (52 Weeks Ended January 31, 2026)
Revenue
Net sales totaled $6.47 billion, compared to $6.48 billion in the prior year. Total retail sales were $6.23 billion, essentially unchanged year over year. Comparable store sales were also flat.
Profitability
Net income declined to $570.2 million from $593.5 million. Earnings per share decreased slightly to $36.42 from $36.82.
Retail gross margin was 40.8%, down from 41.0%. Consolidated gross margin remained unchanged at 39.5%. Operating expenses increased to $1.76 billion (27.2% of sales) from $1.73 billion (26.7% of sales), reflecting higher payroll-related costs.
Net income included:
• A $20.4 million pretax gain from property sales
• $35.0 million in tax benefits related to a special dividend
Cash Flow and Financial Position
Operating cash flow was strong at $717.0 million, slightly above the prior year’s $714.1 million.
At year-end, the company held:
• $861.5 million in cash
• $211.5 million in short-term investments
Total liquidity exceeded $1.07 billion.
Total debt (including current and long-term portions) stood at approximately $321.7 million, down from the prior year. Stockholders’ equity was $1.78 billion.
Inventory increased modestly by 2%.
Capital Allocation
During the fiscal year, Dillard’s paid $484.8 million in dividends and repurchased $107.8 million of stock (approximately 300,000 shares). Shares outstanding declined to 15.6 million from 15.9 million.
Fourth Quarter (13 Weeks Ended January 31, 2026)
Revenue
Net sales were $1.96 billion, down from $2.02 billion. Total retail sales declined 1%, and comparable store sales also fell 1%. The company noted weather-related disruptions in January.
Profitability
Quarterly net income was $203.7 million, compared to $214.4 million in the prior year. EPS declined to $13.05 from $13.48.
Retail gross margin remained stable at 36.1%. Consolidated gross margin improved slightly to 35.4% from 34.9%. Operating expenses rose to $463.0 million (23.6% of sales), mainly due to payroll costs.
Outlook for Fiscal 2026
Management estimates:
• Depreciation and amortization of approximately $175 million
• Net interest income of roughly $5 million
• Capital expenditures of about $130 million
Operational Footprint
Dillard’s operates 271 stores (including 28 clearance centers) across 30 states, totaling 46.0 million square feet, plus its online platform. A new 160,000-square-foot location in Beavercreek, Ohio, is scheduled to open in March 2026.
Conclusion
Dillard’s delivered stable sales and maintained strong margins in a challenging retail environment. Although earnings declined modestly, the company generated robust operating cash flow and strengthened its balance sheet. High liquidity, low net debt, disciplined cost control, and ongoing capital returns position the company conservatively amid macroeconomic uncertainty.
*This is the latest quarterly report that the company has filed with the SEC.
Die Selektion dieser Aktie erfolgte zufällig aus einem breiten Spektrum an tagesaktuellen Börsenmitteilungen bezüglich angekündigter Dividendenzahlungen. Der vorliegende Beitrag zielt nicht auf eine qualitative Bewertung dieser dividendenstarken Aktie ab, sondern verfolgt einen rein deskriptiven Ansatz.
Was sind Dividend Champions, Contenders, Challengers?