Latest dividend announcement
JPMorgan Chase & Co. declared a quarterly dividend of $1.50 per share in March 2026. The payout remains unchanged compared to the previous quarter. The bank has now maintained this level for three consecutive quarters, indicating a pause after prior increases. The forward dividend yield stands at approximately 2.09%, based on the current share price of about $288.
Details of the dividend distribution
The dividend is payable on April 30, 2026. Shareholders of record as of April 6, 2026, will receive the distribution. The ex-dividend date is also April 6. On an annualized basis, the dividend amounts to $6.00 per share. JPMorgan continues to combine dividend payments with significant share repurchases, reinforcing its total shareholder return strategy. In the most recent quarter, the firm distributed $4.1 billion in dividends and executed $7.9 billion in net buybacks.
Relevant valuation metrics
JPMorgan trades at a forward price-to-earnings ratio of approximately 12.2, which remains moderate relative to the broader financial sector. The trailing P/E ratio stands near 14.4. The price-to-book ratio is around 2.27, reflecting a premium valuation supported by high profitability. The bank generated $57.0 billion in net income for fiscal year 2025, with earnings per share of $20.02.
The payout ratio is approximately 29%, which indicates substantial earnings retention. This conservative ratio supports dividend stability and future growth capacity. Return on equity reached 17% for the full year, while the CET1 capital ratio stands at 14.5%, underscoring strong capitalization. Total liquidity exceeds $1.5 trillion, and total assets amount to $4.4 trillion. These metrics confirm JPMorgan’s balance sheet strength and earnings resilience.
Dividend history and sustainability
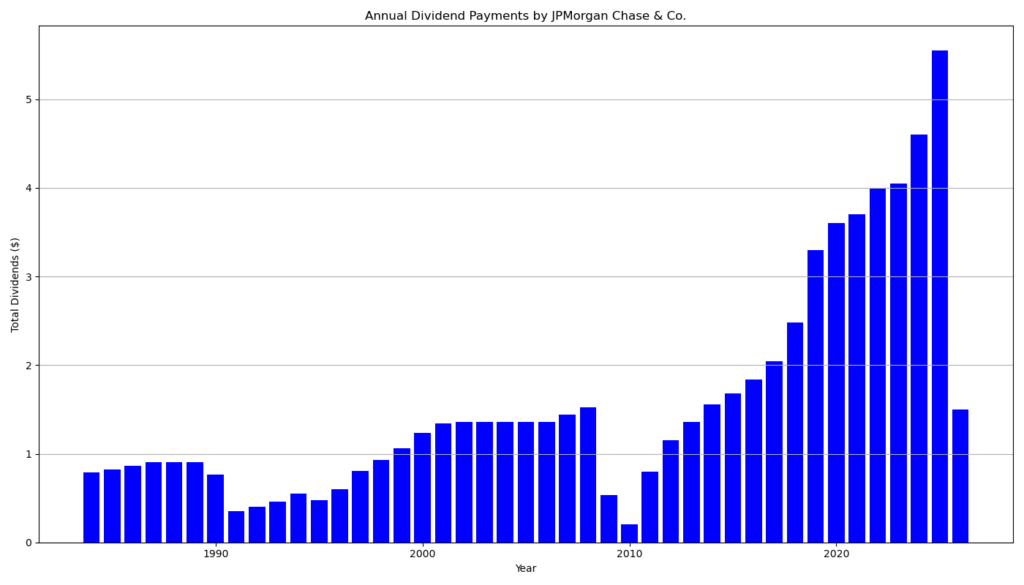
JPMorgan has paid uninterrupted dividends for 29 consecutive years and has increased its dividend for 15 consecutive years. The current dividend of $1.50 compares to $1.25 in early 2025 and $1.05 in early 2024, demonstrating a clear upward trajectory over the past two years.
However, the long-term history also reveals cyclical sensitivity. The bank reduced its dividend sharply during the 2008–2009 financial crisis. This pattern highlights the sector’s exposure to macroeconomic stress. Despite this, the current capital position and regulatory framework are significantly stronger than in prior cycles.
The combination of a low payout ratio, robust earnings base, and excess capital supports dividend sustainability. Nevertheless, rising credit costs—recently driven by higher provisions—represent a key variable that investors must monitor.
Outlook for long-term investors
JPMorgan offers a balanced investment case. The dividend yield remains moderate but well covered by earnings. The bank benefits from diversified revenue streams across consumer banking, investment banking, and asset management. Strong loan and deposit growth support underlying expansion.
However, earnings growth has slowed, and credit costs have increased. These trends could constrain near-term dividend growth. The stock’s premium valuation relative to book value also limits margin of safety.
For long-term investors, JPMorgan remains a high-quality compounder with reliable capital returns. The investment thesis relies more on earnings growth and buybacks than on high dividend yield alone.
A brief company profile
JPMorgan Chase & Co. ranks among the largest financial institutions globally. The firm operates across investment banking, consumer banking, commercial banking, payments, and asset management. It serves millions of retail clients and leading corporate and institutional customers worldwide. As of year-end 2025, the bank reported $4.4 trillion in assets and $362 billion in equity. Its scale, diversification, and capital strength position it as a core holding within the global banking sector.
last quarterly report*
Summary of JPMorgan Chase Q4 2025 earnings
1. Overall Financial Performance
- Net income: $13.0B (↓ 7% YoY)
- EPS: $4.63 (↓ 4% YoY)
- Adjusted net income (excl. one-time item): $14.7B ($5.23 EPS)
- Revenue: $46.8B (↑ 7% YoY)
- Full-year net income: $57.0B
Interpretation:
Revenue growth remains solid, but profitability declined due to higher credit costs and a one-time reserve build.
2. Profitability & Efficiency
- ROE: 15% (down from 17%)
- ROTCE: 18%
- Overhead ratio: ~51–52%
Interpretation:
Profitability remains strong but shows slight deterioration. Efficiency is stable but not improving.
3. Credit Quality & Risk
- Provision for credit losses: $4.7B (↑ sharply YoY)
- Net charge-offs: $2.5B
- Reserve build: $2.1B (incl. $2.2B Apple Card portfolio impact)
Interpretation:
Credit costs are rising significantly. This is a key negative signal and reflects either normalization or early-cycle stress.
4. Balance Sheet & Capital Strength
- CET1 ratio: 14.5% (Standardized)
- Liquidity (cash & securities): $1.5T
- Total loss-absorbing capacity: $564B
- Book value per share: $126.99 (↑ 9% YoY)
Interpretation:
Capitalization remains very strong. JPM continues to operate with excess capital and high resilience.
5. Segment Performance
Consumer & Community Banking (CCB)
- Net income: $3.6B (↓ 19%)
- Revenue: $19.4B (↑ 6%)
Drivers: Higher deposits and fees, but rising credit costs.
Commercial & Investment Bank (CIB)
- Net income: $7.3B (↑ 10%)
- Markets revenue: ↑ 17%
Drivers: Strong trading activity, especially equities (+40%).
Asset & Wealth Management (AWM)
- Net income: $1.8B (↑ 19%)
- AUM: $4.8T (↑ 18%)
Drivers: Market performance and strong inflows.
6. Capital Return (Dividend & Buybacks)
- Dividend: $1.50 per share (quarterly)
- Total dividends paid: $4.1B
- Buybacks: $7.9B
- Payout ratio (LTM): 82%
Interpretation for dividend investors:
- High payout ratio suggests strong shareholder return focus.
- Sustainability depends on earnings stability given rising credit costs.
7. Growth Indicators
- Loans: +9% YoY
- Deposits: +6% YoY
- Client assets: >$7T
- Mobile users: +7%
Interpretation:
Underlying business growth remains robust across retail and institutional segments.
8. Key Risks Highlighted by Management
- Sticky inflation
- Geopolitical risks
- Elevated asset prices
- Potential credit deterioration
9. Critical Assessment
Positives
- Strong revenue growth across all segments
- Exceptional capital strength
- Leading market position in investment banking
- Robust capital return (dividends + buybacks)
Negatives
- Rising credit costs (material concern)
- Declining net income despite higher revenue
- Increased dependence on market-driven revenues (volatile)
- One-off items masking underlying trends
Bottom Line
JPMorgan delivered strong top-line growth but weaker bottom-line quality. The business remains fundamentally solid, but credit normalization and macro risks are becoming more visible.
For dividend investors, the stock remains attractive due to:
- Strong capital base
- High payout capacity
However, earnings pressure could limit near-term dividend growth acceleration.
*This is the latest quarterly report that the company has filed with the SEC.
Next Earnings Date: 4/14/2026 7:00 AM
Die Selektion dieser Aktie erfolgte zufällig aus einem breiten Spektrum an tagesaktuellen Börsenmitteilungen bezüglich angekündigter Dividendenzahlungen. Der vorliegende Beitrag zielt nicht auf eine qualitative Bewertung dieser dividendenstarken Aktie ab, sondern verfolgt einen rein deskriptiven Ansatz.
Was sind Dividend Champions, Contenders, Challengers?